There’s a simple blunder out there that pretty well every income investor makes at one time or another.
It’s costly, both in terms of lost income and missed gains. And it starts in perhaps the most innocent place of all: the free stock screeners you likely use every day—Google Finance and Yahoo Finance chief among them.
This slip-up affects all high-yielding stocks. In fact, the higher the yield, the more it can steer you wrong! So for those of us who invest in closed-end funds (CEFs), what we’re going to discuss today can cause a real mess.
The good news? We can easily fix this mistake.
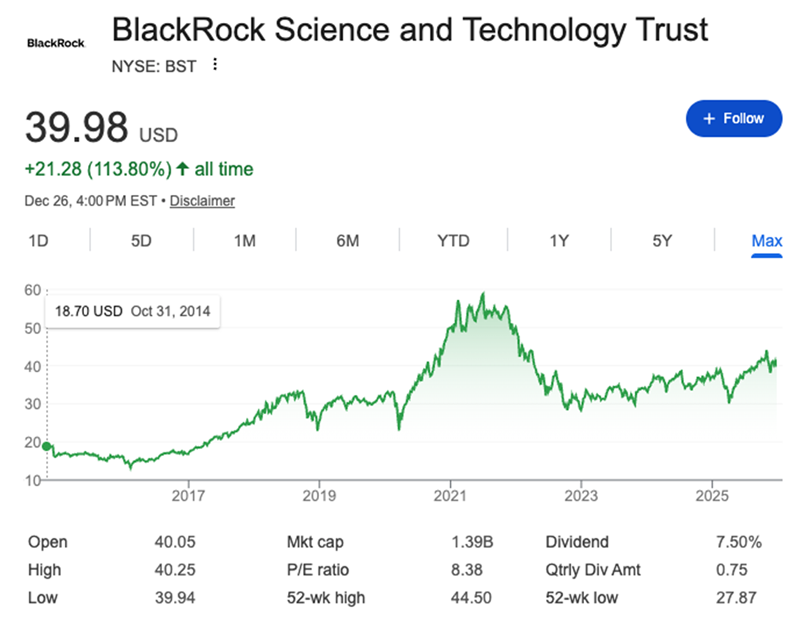
To show you how, let me choose a high-yielding CEF from the portfolio of my CEF Insider service. This one is smartly run (by the world’s biggest asset manager, no less), yields 7.5% and has crushed the market for more than a decade. But if you make the mistake we’re going to talk about today, you could easily take one look at this fund and pass it by.
The fund I’m talking about is the BlackRock Science and Technology Trust (BST), a CEF that holds many of the major tech stocks, including Apple (AAPL), Microsoft (MSFT) and NVIDIA (NVDA). So you’d expect it to have strong long-term returns, on top of its 7.5% dividend. Let’s look at how it’s done over the last decade.
Tech-Powered BST Doubles (and Then Some) …
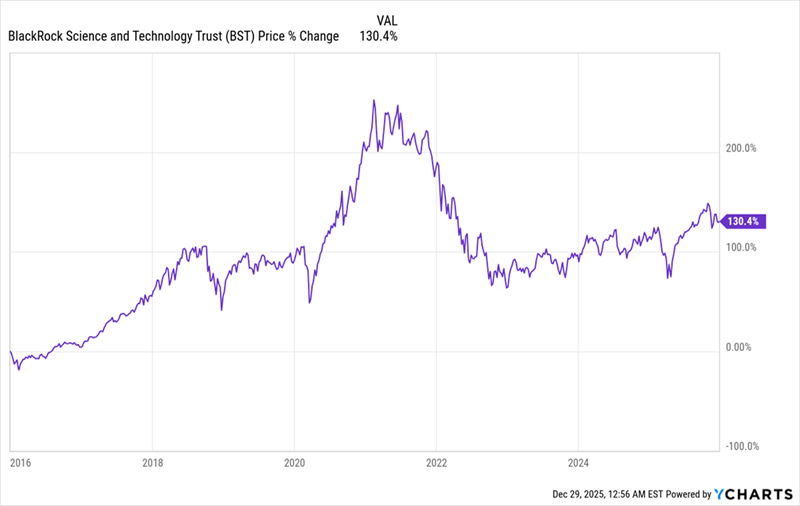
BST’s market price is 130.4% higher than it was a decade ago, as of this writing. That already sounds good, right? But since this is a fund of stocks, we should compare it to the S&P 500. So let’s do that, using the “go-to” ETF tracking the benchmark index. (BST is in purple below; the index fund is in orange.)
… But Still Gets Clobbered by the Market?
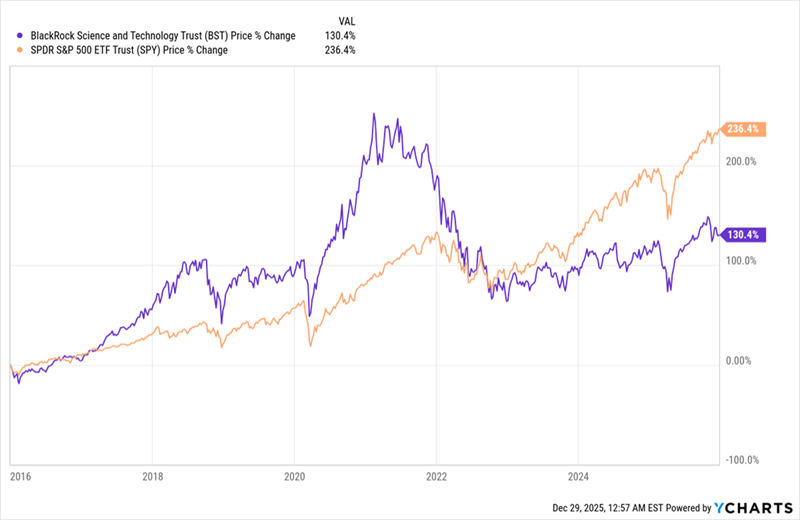
Check this chart out—the S&P 500, with less tech exposure than BST, has crushed BST over the last decade! BST is clearly a dud, then, right?
Or is it?
Total Returns Boost BST’s Profits …
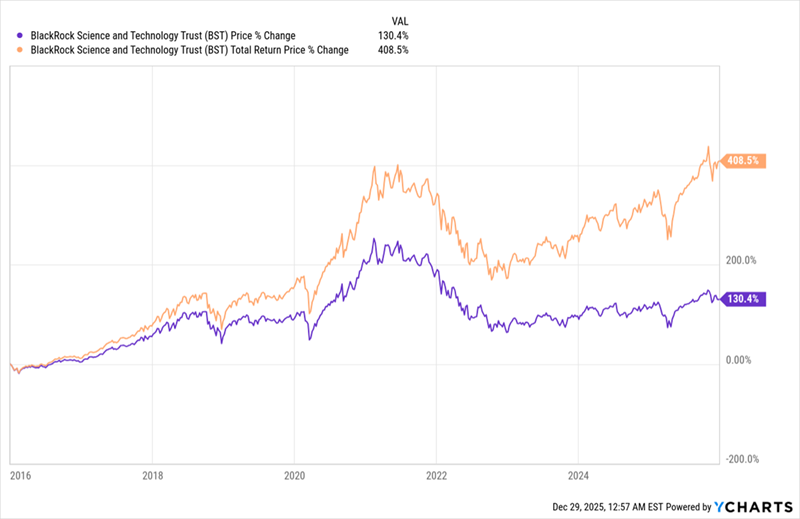
The above chart shows two numbers: The purple line is the one you’ve already seen, showing BST’s 130.4% price gain (remember that phrase for a second) over the last decade. The orange line, however, shows a 408.5% total return for the fund. That’s obviously much higher.
And if we take this one step further and compare the total return for BST with that of the benchmark index, we see that the S&P 500 (in orange below) did a bit better than it did in our earlier chart, but is still well behind BST (in purple):
… And Push It Past the Market
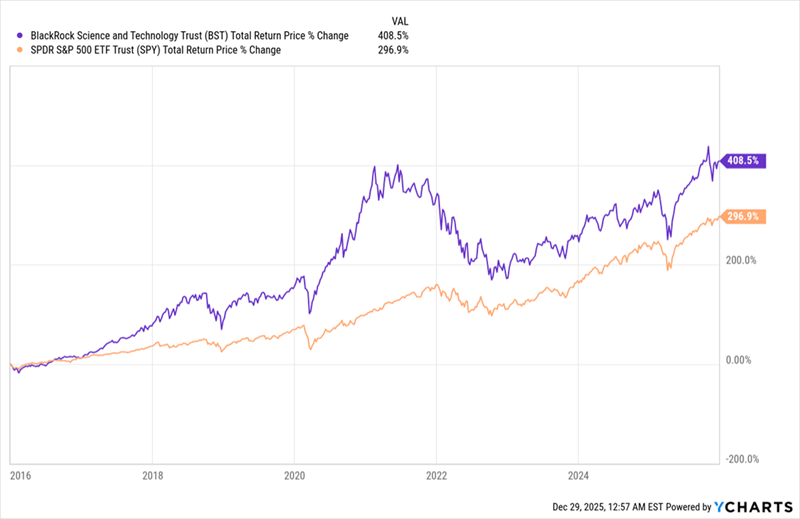
Now, all of a sudden, BST has crushed the market and delivered a huge profit. Investors who invested $10,000 in this fund back in 2016 would have earned a profit of $40,850. That’s a lot more than the $13,040 the first chart showed a hypothetical BST investor getting.
So what’s going on here?
The Total Story on a 408.5% Win
There are two ways to measure a stock or fund’s performance.
One is by looking at its market-price return. The other is by looking at its total-market-price return. The only difference between the two is dividends: With a market-price return, we just look at the stock or fund’s current market price and what it was in the past, then we calculate the difference.
With a total market price return, you get that and all of the dividends the fund paid, assuming they were reinvested on their payment date.
Now, since most popular stocks don’t pay much of a dividend—NVIDIA yields 0.02%, Apple yields 0.4% and Mastercard (MA) yields 0.6%, just to name a few examples—this doesn’t matter much to mainstream investors.
As a result, most free stock screeners don’t bother with total returns and just tell us how the stock price has changed. Here’s what BST looks like if you search it on Google Finance and zoom out to see how it performed since its IPO:
Now compare that to this total-return chart, which includes all the dividends the fund has paid since its IPO:
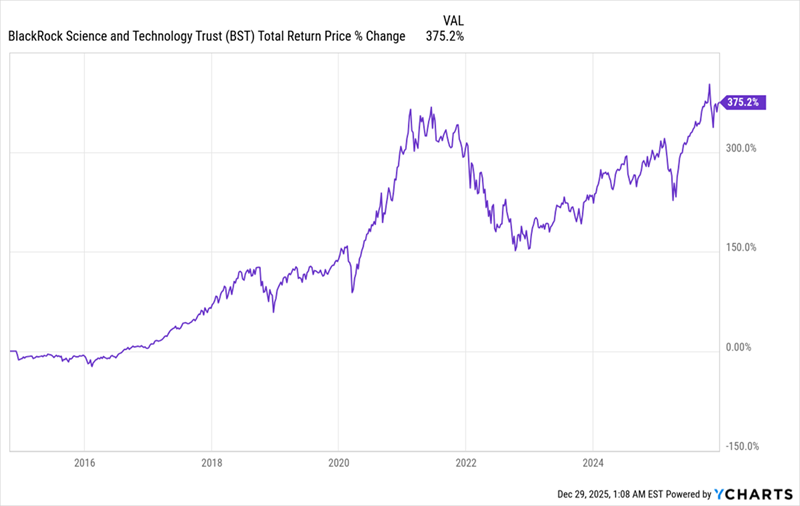
Big difference, right?
Remember that, like BST, CEFs focus on paying out most of their returns as dividends. The average CEF tracked by CEF Insider yields 8.9% right now, compared to 1.1% for the average S&P 500 stock (with many paying no dividends at all).
This means that if you look at a simple market-price chart of a CEF, without looking at the dividends, you’re looking at a chart that excludes most of the story. That’s why we need to be careful when researching CEFs on the internet.
Start 2026 With Your First Big Dividend “Paycheck” (and 59 More to Come!)
What if I told you that now, as we roll into 2026, that we’re going to turn more—heck, maybe even all—of your portfolio into a well-oiled monthly dividend machine?
I’m talking about a continuous cash stream that rolls into your account 5 TIMES a month, for a total of 60 dividend “paychecks” over the next 12 months.
Your average yield? A rich 9.3%.
That’s exactly what I want to help you do in the early days of the new year. And the 5 monthly paying funds I’m pounding on today hold the key. They boast:
- High, strong yields. That’s right: 9.3% on average! So you’re getting $9,300 a year on every $100K invested here.
- Instant diversification: These 5 funds come from across the market, holding the top stocks, bonds, REITs and more.
- Deep discounts, which will help drive their prices higher as these unusual markdowns slam shut.
I’ve prepared a full investor report that takes in you inside these 5 rich monthly payers and shows you exactly how they’ll kickstart your 60-dividend income stream for 2026. Click here to read it and get a free Special Report revealing these 5 funds’ names and tickers. It could be the best investment decision you make all year.