I’ve seen a lot more news stories trying to do something that seems a bit weird these days: stoke anger between generations.
I bring this up because it’s an example of why, when it comes to picking stocks (and 8%+ paying closed-end funds), we simply can’t trust the media anymore.
Why? Because many outlets are so focused on generating emotional responses (and the clicks that go with them) that they’ve gotten far away from what really matters: the real data behind what they’re saying.
With that in mind, we’re going to look at a data-driven indicator that tells us whether or not it’s a good time to buy. No fear. No clickbait. Just pure data.
What I’m going to show you is not something you’ll read about on financial sites. That’s because it takes just a bit of digging to get to it—and most journalists can’t be bothered!
Which brings me back to those intergenerational “rage” stories. They’re out there because there’s simply no better way to enrage a reader than to write about, say, how millennials are lazy or baby boomers are selfish. Or, in the case of Business Insider, how “Boomers are clinging to their jobs, homes and halls of power.”
If this narrative sounds outrageous, that’s because it is. In fact, it’s just not true. Funny thing is, most times, these manipulations can be unmasked pretty quickly. Take the canard about boomers “hoarding” homes.
The Theory: Boomers Are Blocking the Path to Housing for Everyone Else
A lot of articles on this have popped up lately, a number of which have been based on a National Association of Realtors study showing that the median age of a first-time homebuyer is now 40, up from the early 30s from the 1990s until the pandemic.
The implication here is that these folks are essentially aging out of their prime first-time-homebuying years as boomers refuse to sell.
But lucky for us (and not so much for the media), the NAR isn’t the only group doing research on this stuff, and other sources tell a different story.
Both the Census Bureau and Federal Reserve have been asking the same question, and the answer they came up with is not 40. It’s actually 36, and that number is lower than what it was throughout the 2000s and much of the 2010s, as you can see in the blue line below.
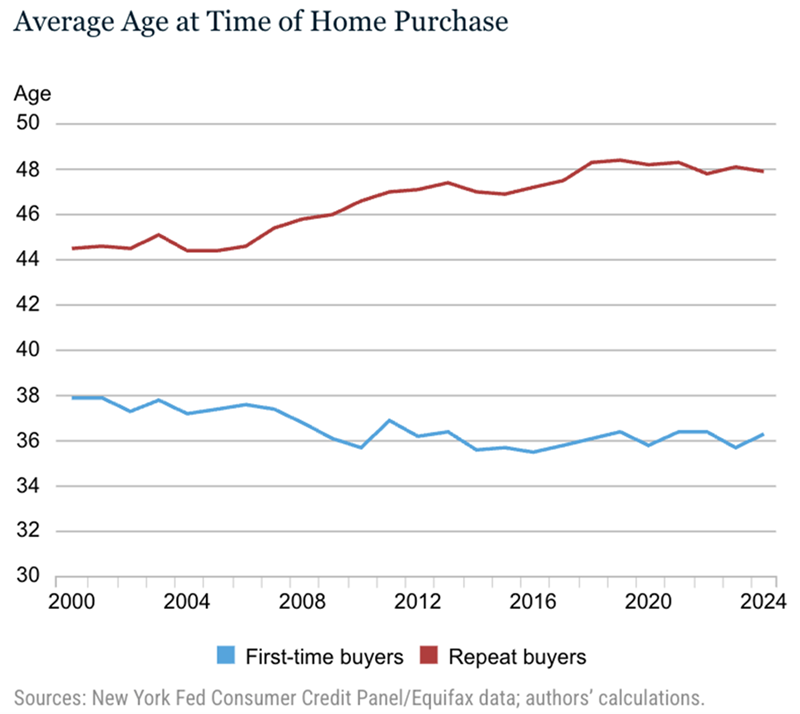
That’s a big difference, especially in how the Fed sees first-time homebuyers being younger in 2024 than they were in the 2000s, the exact opposite of the NAR survey.
So what gives here?
In short, it’s all about methodology. The NAR mailed questionnaires to households asking questions like “Is this your first home purchase” and “How old are you?”
Since older people tend to be more open to mail surveys, this skewed the numbers upward. It’s shown in the response rate: Just 3% of surveys got full responses in the NAR’s 2022 effort, making them a poor snapshot of the real situation.
Yet this study was the one that drove the most headlines.
Meanwhile, both the Census Bureau and Fed used actual data to zero in on who these first-time homebuyers are, both by looking at government data and information from credit bureaus. That’s much more reliable than a survey mailed to random houses.
Now, things aren’t perfect. You can see that even the Fed data shows the average age of the American repeat homebuyer is up from 44 in the early 2000s to 48 in 2024. But bear in mind that the average American is four years older now than in 2000.
The population is indeed aging, after all!
Now, if we keep in mind Americans are on average older than they were a generation ago and the average age of first-time homebuyers is lower than it was a generation ago, all of a sudden, our story is happier: We’re becoming an older society, but younger people can still buy a home.
The “Happy” Story Gets Buried
When I was a full-time journalist, I pitched stories like this, and they got shot down because they’re too upbeat. This is why I didn’t stay in journalism for long.
This is where we come back to the markets.
The boomer housing story is far from the only pessimistic tale being peddled these days. Another is fear of an AI-driven stock bubble. The results can be seen in one of my favorite indicators of stock-market sentiment: the CNN Fear and Greed Index.
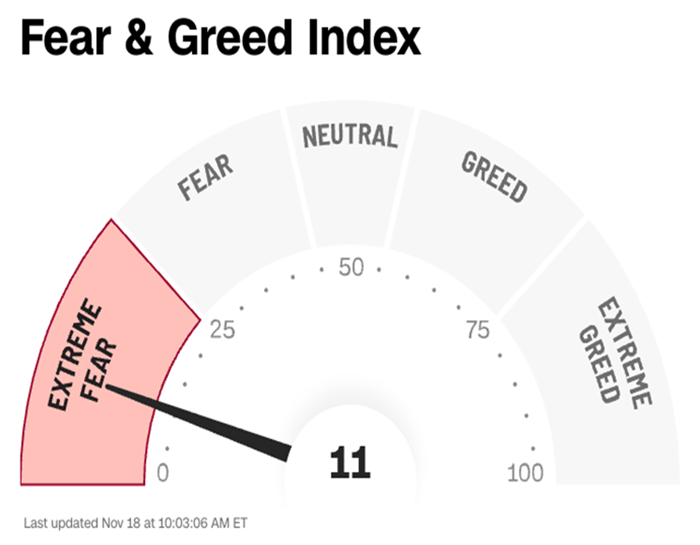
Source: CNN.com
The average investor is very worried these days, and I’m not surprised! The news is trying to ramp up the fear, and every once in a while, it succeeds. But market performance belies something else: As of this writing, stocks are still up around 13.5% in the past year, far from a panic.
Similarly, the discount to net asset value on CEFs—the real indicator I wanted to tell you about—is around 5.3% as I write this. This measure shows how far the fund’s market price (or its value on the open market) is below its net asset value (or NAV—the value of its portfolio).
Since CEFs (which trade on the open market, like stocks) generally have the same share count for their entire lives, their prices can be much different than their portfolio values. This not only tells us when a CEF is cheap but, when you look at the average discount across all CEFs, it gives us a good snapshot of where investors really are.
Right now we see that this 5.3% discount is a bit narrower than the long-term average of around 7%. This shows that the “fear” on the news isn’t prompting people to sell.
There are a lot of conclusions one can draw from this, but the most important is that the media is not a reliable indicator of actual market sentiment.
The Market Is Rational, But These 9.2% Dividends Are Still Ridiculously Cheap
As we just saw, the average CEF discount is telling us that this market is rational, despite the volatility we’ve seen lately.
That makes now a great time to pick up our favorite 8%+ yielding CEFs, especially if we can grab them trading at unusual discounts.
And right now we absolutely can.
To make it as simple as possible, I’ve put together a “mini-portfolio” of 4 high-yielding CEFs I’m urging all investors to buy now. They’re cheaper than the average CEF, positioning us for some nice upside as those deals “snap back” to normal.
AND they pay a stout 9.2% average dividend, so we’re getting nearly 10% of our upfront investment back every year in cash. And that’s in addition to any upside from these 4 funds’ disappearing discounts!
Don’t miss these rich “dividend deals.” Simply click here and I’ll tell you more about these 4 potent income plays and give you a free Special Report revealing their names and tickers.