Last week’s hot inflation reports have handed us a timely “two-step” 10.3% dividend opportunity. We’re going to jump on it today.
Here’s our plan:
- Step 1: We grab a 10.3% average dividend now, to fend off rising inflation, then …
- Step 2: We ride along as interest rates fall, driving up the value of the two funds behind that steady 10.3% divvie.
I know, I know. How can I be talking about falling rates at a time like this?
The Strait of Hormuz is closed. Oil is at $100. And last week saw two hot inflation reports: CPI hit 3.8% in April, and the PPI (producer price index) soared 6%.
I’ll get to that in a second, but let’s start with Step 1: that 10.3% average yield. It comes from two closed-end funds (CEFs) that have seen their discounts to NAV drop to, frankly, ridiculously low levels.
One is a 9.3% payer trading for 10.8% below NAV (or the value of its portfolio). The other is a 12%-paying bond fund whose price falls when rates (and rate fears) rise. But—and it’s a critical “but”—this fund’s yield rises at the same time.
Irrational worries have both funds at “peak yield” right now. We want to lock those in before rates fall. Which brings us to Step 2.
AI Enters the Chat
In the longer run, rates will fall.
For one, this war will eventually end. Neither country can afford to have it drag on. An agreement will reduce inflation. And we can be sure new Fed chair Kevin Warsh will push for rate cuts the first chance he gets.
This is just the opening act in the rate story, though. AI is the headliner.
We haven’t been talking about it as much these days, but the robots are taking jobs: According to research by Goldman Sachs (GS), AI is eliminating roughly 16,000 jobs a month. As that continues, it’ll weigh on inflation.
Wage growth is sagging, too.
In April, it was 3.6%, below the 3.8% CPI print. When price gains outrun wage gains, consumers cut back, putting more downward pressure on inflation. The cure for high prices is high prices!
Funny thing is, little of this has registered with investors. Which makes now the time to lock in our 10.3% payout, before they wake up to the facts here. Let’s start with …
CEF #1: 12.0% Payouts From a Manager With “Swagger”
The DoubleLine Income Solutions Fund (DSL) is a holding of my Contrarian Income Report service (and a fund I bring up often in these columns). It trades at a 4.5% discount to NAV as I write this—a level we haven’t seen this consistently since late 2022, when inflation hit 8%!
DSL’s Discount Goes Back to 2022 …
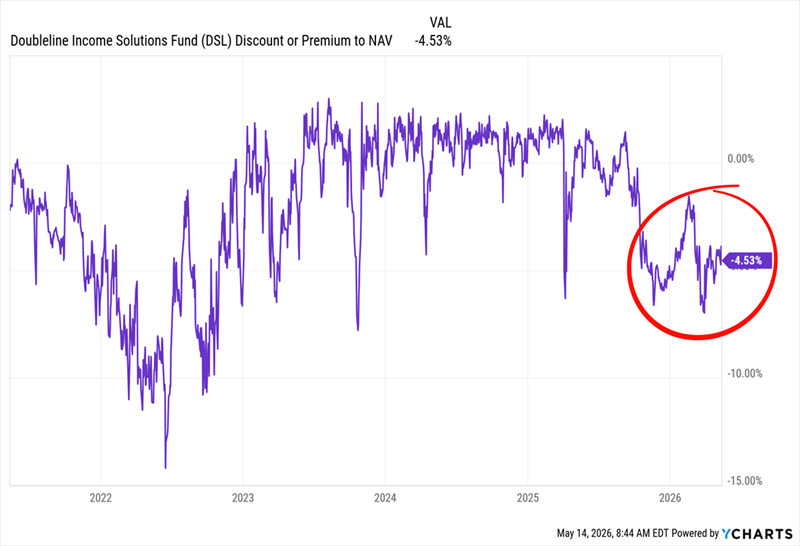
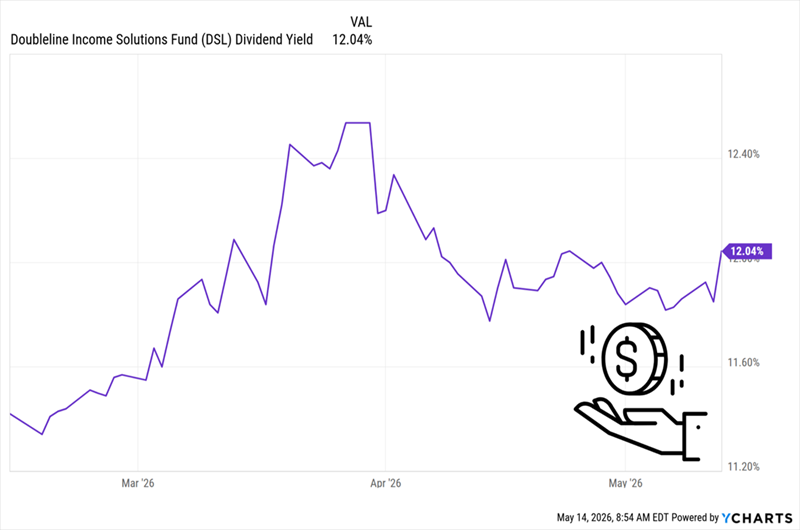
That’s ridiculous for a fund run by the “Bond God,” Jeffrey Gundlach, who’s got a wide mandate to scour the credit market. The discount’s pullback has also pushed the yield up to that sweet 12%.
… Sending Its Dividend Yield North of 12%
DSL also pays monthly, and held its payout steady through the 2022 dumpster fire (a year Gundlach capped with a special dividend—talk about swagger!)
The Bond God’s Steady Payout
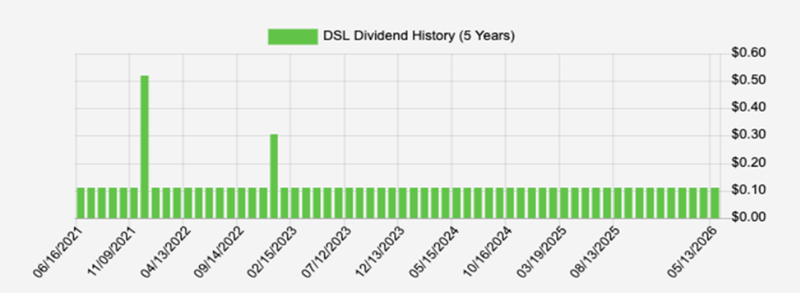
Source: Income Calendar
This one is a textbook contrarian play on the herd’s inflation panic. We’re happy to take the other side of the argument, especially with dividends and discounts as high as these.
CEF #2: A 9.3% Pharma Payout AI Is Coming For (in a Good Way)
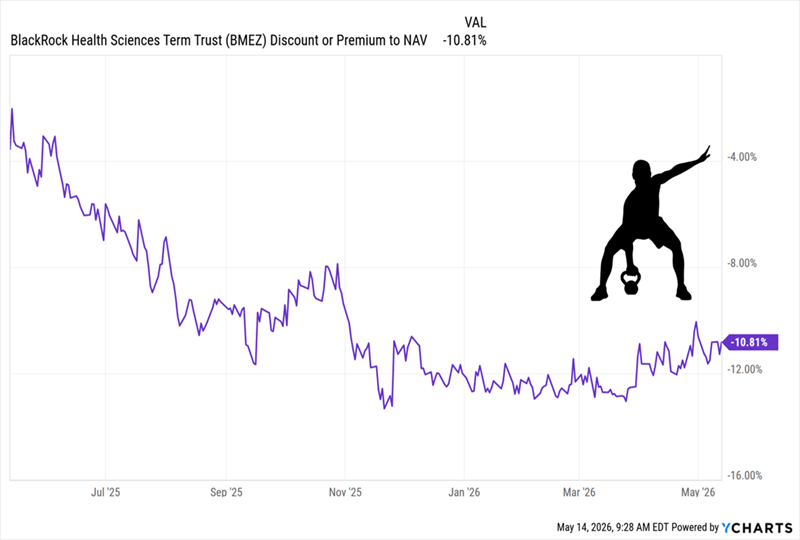
The 9.3%-paying BlackRock Health Sciences Term Trust (BMEZ) sports a discount in the “sweet spot”—down in the last year (thanks to tariffs and RFK Jr.), but on the mend now.
BMEZ’s “Discount Rebound” Gets Rolling
We can thank AI for our opportunity here. As we’ve written before, the tech is set to slash drug-development times, adding billions of sales for drug stocks like BMEZ holdings Merck & Co. (MRK), Moderna (MRNA) and Gilead Sciences (GILD).
That’s not priced into BMEZ, with its 10.8% discount well below its year-ago figure of 3.5%. Management did cut the payout last fall—another reason why BMEZ is in the doghouse.
But that cut shifted the payout from a floating rate to a fixed $0.11 a share monthly. And the fund still offered a high 9.3% yield after the cut—same as today. BMEZ traded at a roughly 11% discount then, too.
In other words, we’re paying the same as we would’ve right after the cut for a safer, more predictable payout. And again, AI’s impact on drug development isn’t fully priced in. That makes now the time to buy.
With BMEZ and DSL, we’ve got a 10.3% average yield, with dividends paid monthly. That’s a big help in offsetting inflation in our day-to-day lives. Plus, their wide discounts line us up for upside as rates fall and AI productivity gains kick in.
Now let’s make another move for even more peace of mind: We’ll map out our payouts well into the future, so we know exactly how much we’re getting and when—down to the day (and the penny).
Buy DSL and BMEZ, Then Drop Them Into This Unique “Dividend Predictor”
If there’s one thing we dividend investors know well, it’s the value of a high, steady income stream in stressful times like these.
This is where our Income Calendar dividend-tracking tool comes in. It lets us clearly see our income stream, month in and month out, with a level of detail you won’t find anywhere else.
Best part is, it’s integrated with Plaid, so it can safely and securely link to your brokerage account with no inputting on your end. (When we rolled this feature out, I linked it to my Schwab account with just a few clicks.)
The upshot? Income Calendar lets you quickly and easily ensure your dividends are in your account before your bills come out.
Let’s walk through it with monthly paying BMEZ and DSL, then toss in two other holdings from Contrarian Income Report that pay quarterly, to add some variability to our income stream.
Those would be pipeline operator Antero Midstream (AM), which benefits as the Iran conflict squeezes global LNG supplies—and Dominion Energy (D), which feeds AI’s bottomless power demand.
Let’s invest an imaginary $100,000 in each. Income Calendar tells us, in seconds, what we can expect in dividends every month from our 4-buy “mini-portfolio”:
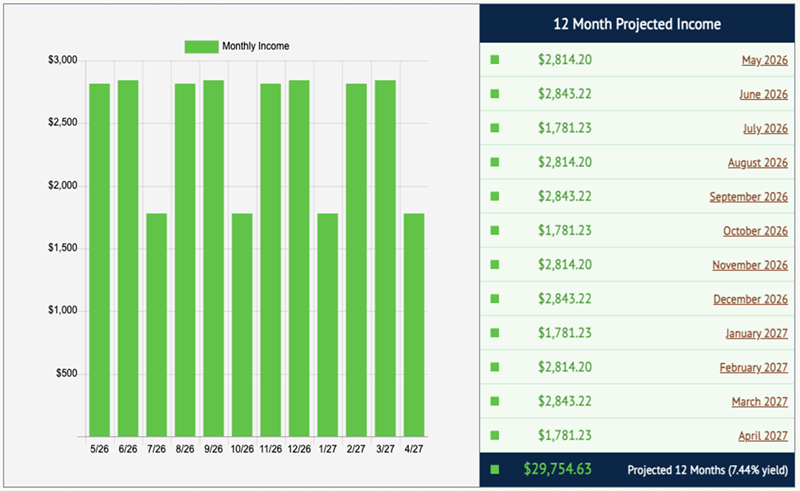
That’s a sweet setup, with our two monthly payers giving us a solid base and our two quarterly payers juicing our income every second and third month.
This mix still gives us fairly consistent income, ranging from $1,781 to $2,843 a month. The total comes to $29,755 on the year, for a 7.4% yield. (Note that IC doesn’t project dividend growth, just to be conservative, so our real payouts could be even higher.)
You can get breakdowns by stock, plus a month-by-month calendar showing key dates for every holding. Check out what’s on tap for our “mini-portfolio” next month:
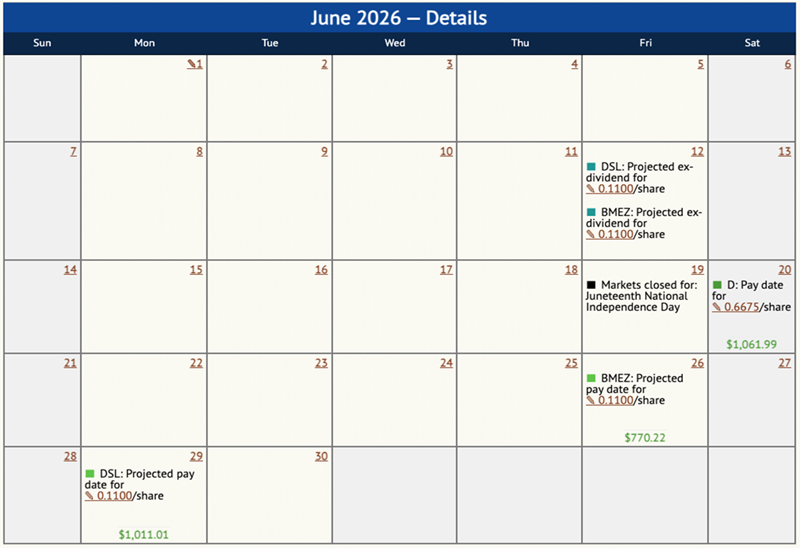
We can see our projected pay dates, as well as ex-dividend dates (the dates before which we need to be “in” the stock to get the next payout).
We also get a heads-up on things like market holidays and when our stocks report earnings—though with two of our picks being CEFs, our quartet is light on those, with none in June.
There’s more, too, like:
- Real-time email alerts when dividends are announced.
- A “week-ahead” payout summary.
- A handy tool that tells you your “yield on cost” (so you can see the “true” yield on each of our stocks, based on your original investment).
Now, with inflation rising, is a great time to try Income Calendar so you know exactly what’s coming your way on the income front. Simply click here to learn more about this powerful dividend-forecasting tool and try it out for yourself.