Quite often, investors come into the market with the false perception that making money is a guarantee.
However, many learn the hard way that’s not often the case.
That’s because they come into the market without a game plan.
And as any investor will tell you, that’s a bad idea — especially in today’s volatile market.
In fact, with markets saturated with fear over the trade war, and with an inverted yield curve pointing to a recession, you must have a plan. After all, if you fail to plan ahead, you plan to fail.
If you want to do well in a fear-based market, plan ahead like a billionaire.
After all, fear is attractive to smart investors.
Warren Buffett, Baron Rothschild, and Sir John Templeton all used fear as a buying opportunity.
To this day, Buffett still advises that a “climate of fear is your friend when investing; a euphoric world is your enemy.” And of course, we all remember his advice to “be fearful when others are greedy and greedy when others are fearful.”
Sir John Templeton bought excessive pessimism.
Instead of relying on a forecasting model, he’d rely on extreme fear among investors.
The best example was in 1939. Europe was just about decimated. So, Templeton bought every European stock trading below $1.00 a share and made a fortune. He would buy shares in 104 companies for about $10,400. Four years later, his account balance topped $40,000.
Baron Rothschild once told investors, “The time to buy is when there’s blood in the streets, even if the blood is your own.” He knew that very well, considering he made a small fortune buying the panic that followed the Battle of Waterloo against Napoleon. In short, if you can embrace fear in times of maximum pessimism you can make a fortune, he’d tell you.
Granted, they were all fundamental investors.
And so are we. But we can also add technical mean reversion to create sizable income, faster. The best part – we can monitor the very psychology of the investing herd, and pinpoint the exact time an income opportunity may present itself.
How to Spot Fear for Opportunity and Yield
Several years ago, hundreds of sheep jumped off a cliff.
One sheep dove. Another followed. All of a sudden, flocks of sheep began jumping off a cliff. Unable to do anything, shocked shepherds watched as 1,500 sheep jumped to their deaths.
Each of those sheep followed and jumped simply because every other one was doing it.
And as uncommon as their actions may sound, it’s not.
In fact, it happens every day to investors.
Especially when we sell stocks just because everyone else is doing it. All of a sudden, the sky is falling. Your favorite stock is plunging out of the sky. You, along with hundreds of investors, sell out of fear. The fear becomes palpable. More investors jump ship, sell, and run.
It happens all the time. Sometimes for no reason at all.
But if you can spot that action, you can generate sizable, consistent income just like a billionaire.
How to Cash in on the “Bungee Cord” Stocks
If you jump off a bridge with a bungee cord, what happens?
Eventually, the cord stretches out to far, and bounces back with you hopefully still attached, right? The same thing happens with your average stock.
When investors become fearful, they panic sell – oftentimes sending the best of the best stocks spiraling to an unsustainable low. However, at some point, it gets too low. And eventually, it begins to bounce back to the mean.
Just like a bungee cord.
If we can spot that we can spot opportunity, and the potential for impressive income.
All we need to use are three key technical indicators that can pinpoint potential reversals. Now, before I lose any of you on these next explanation, know this. These technical indicators have had a 20-year success rate of calling the bottom of stocks very, very well.
These include:
Bollinger Bands
The idea behind such bands is simple. If we stretch our stock too far in one direction, the Bollinger Bands will let us know our “bungee cord” is about to snap back. It’s our “line in the sand,” if you will. For example, if the stock in question falls to the lower Band, fear has gotten way out of hand.
Then again, we never want to rely on just one indicator, so we begin to look at others for confirmation.
Relative Strength (RSI)
Relative strength, or RSI is another solid technical tool that will let us know how strong or weak the overall trend may be. If for example, our stock is falling out of the sky, it’ll let us know when the selling spree may be overdone. To get a bit technical, when RSI moves to or below the 20-line, we have an oversold condition.
Williams % Range (W%R)
We can round things out with Williams’ %R, too. This is another great indicator that will let us know if our stock in question is down too much. Again, to get a bit technical, if W%R moves to or below its 80-line, we have an oversold condition.
While billionaires like Warren Buffett don’t believe in using technical analysis, it’s part of our overall game plan for success. After all, if we don’t plan ahead, we plan to fail.
But how does this work exactly?
How to Use these Indicators for Predictable Income
Let’s look at AT&T (T) for example.
As most of us are aware, AT&T is a telecommunications behemoth with more than 100 million customers in the U.S. and Latin America, with services ranging from wireless, broadband, cable, and satellite television. What makes a stock like AT&T so attractive though is its dividend yield of 6.3%. The best part – the company has now increased its dividend for 35 consecutive years.
At first glance, this may be confusing – but stay with me here.
This is a two-year technical chart of AT&T (T).
At first glance, it just looks like a bunch of lines, dips, and blips. So, let’s take a closer look at two extreme instances of fear in the chart, which allowed us to spot excessive fear and opportunity.
Take a look at how the three indicators mentioned above are highlighting — in unison — where the “bungee cord” has been stretched too far.
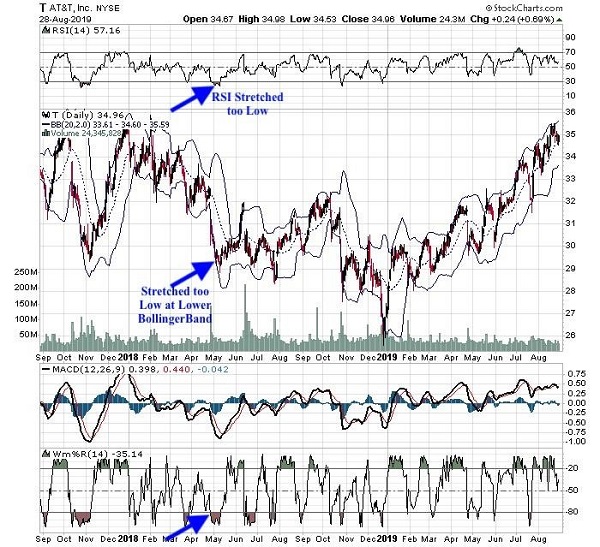
Chart courtesy of StockCharts.com
Shortly thereafter, the stock reversed higher, as you can see in this second chart.
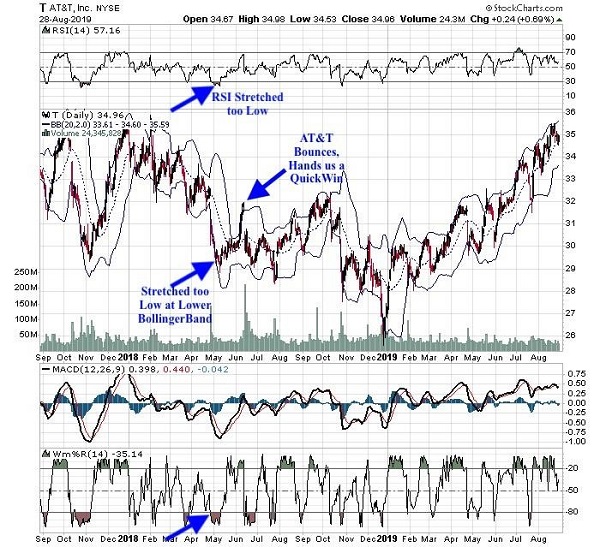
Chart courtesy of StockCharts.com
The best part — you can see the same setup repeats itself over and over again, letting us know where and exactly when to begin to buy fear.
We can see a similar set up in the Vanguard Real Estate ETF (VNQ).
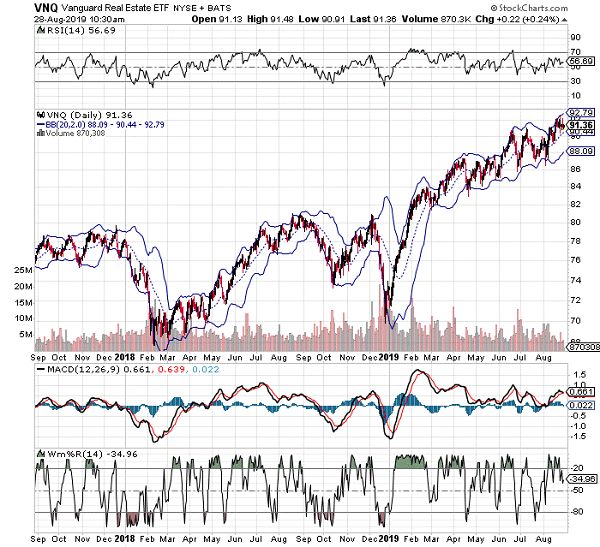
Chart courtesy of StockCharts.com
As Chief Investment Strategist Brett Owens said, “The key takeaway for the fundamental investor who never pays attention to technical analysis is that regression to the mean is one of the few reliable things in the market. So rather than chase their favorite dividend stock and buy high and maybe get frustrated and sell low, they can wait patiently and buy it when these types of indicators start to line up.”
Granted, we are fundamental analysts.
However, to find opportunity—to plan ahead in a crazed market—we need to think outside the box at times. After all, if we fail to plan ahead, we may as well plan to fail.
And that’s not how great retirement income is built.
With the trade war, and inverting yield curves pointing to recession, our “2008-Proof” Income Portfolio also trades fear just like Buffett, Rothschild, and Templeton.
The best part: we’ve found five rock-solid opportunities that pay 7.5% yields on average.
Then again, 7.5% is just the average! One of these titans pays a SAFE 8.5%.
And these standout stocks have stood out through one meltdown after another—with reliable, sizable income to boot.
Think about that for a second: You’re being offered an opportunity to earn up to 8.5%—and it doesn’t matter how bad the fear is in the market. Not only is that a safe move, it’s protecting your portfolio and your retirement from sudden jolting shocks.
That’s exactly how you need to be planning ahead in this market.