I never thought I’d see the day when “yen carry trade” was splashed across the financial news. But here we are.
We talked about this weird setup, and how it sparked the August 5 market crash, in Monday’s article. Today we’re going to get into what it all means for closed-end funds (CEFs), including the opportunities now available to us in these high yielders.
First up, while the press was quick to paint the correction as a “made in Japan” event, we do have some signs of a slowdown starting to appear in America.
Is This the Recession We’ve Been Waiting For?
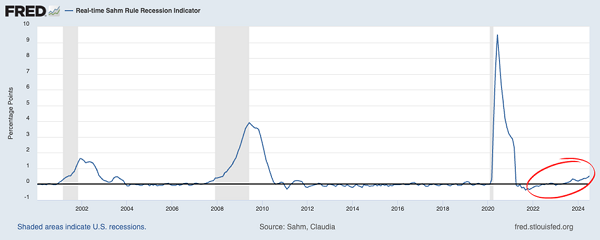
The chart above is an indication of the Sahm Rule, another once-obscure item (see the theme here?) that’s now in the mainstream. Readers of my CEF Insider service will recognize this, as we talked about it last year as an indicator of an oncoming recession.
The short version is that if the blue line above goes over 0.5, as it now has (see at right on the chart above) the odds of a recession in the next year or so rise. That’s because the rule is based on unemployment trends: a higher number indicates rising joblessness, a vicious cycle that typically ends up in a recession.
Or at least it has in the past. Which is why those peaks and the gray areas in the chart (which measure US recessions) are so closely correlated. So with the indicator now north of 0.5, are we on track for a recession?
Torsten Sløk, the head economist at Apollo Global Management (one of the world’s largest managers of venture-capital and private-equity funds) thinks not. Here’s why:
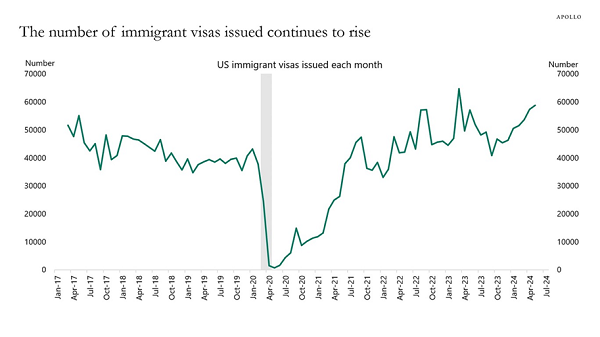
Source: Apollo Global Management
His reasoning comes down to a backlog in processing work visas. Sløk writes: “Maybe the reason why the unemployment rate is rising is because the government is gradually working through a COVID-related backlog of visa applications, which increases the labor supply.”
This would mean that because of these outstanding work-visa applications, more people are available to work, while there’s no change in the number of people working until the visa-application process is complete and the person either gets a job or is denied. In both cases, the temporary change to the unemployment rate disappears.
Let’s be honest: This is all a bit convoluted. Can it really be what’s going on here? One thing we can say for sure is that whatever is happening in the job market isn’t hurting US companies’ sales.
Corporate Sales Keep Rising
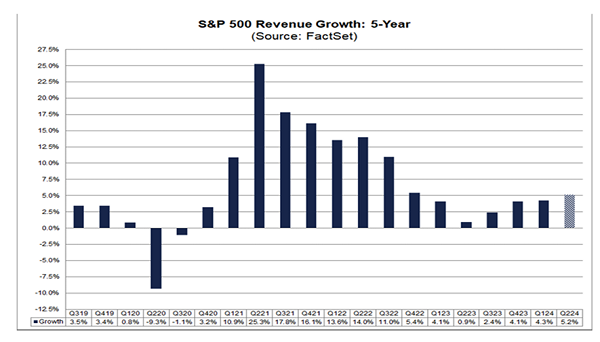
As you can see, S&P 500 sales growth has risen since the second quarter of 2023, and the trend is accelerating.
How We’re Approaching Stocks—and CEFs—Now
In short, my bullish view on stocks hasn’t changed. But the recent volatility has made timing a stock buy more difficult.
To be sure, stocks are still up nicely on the year: 12% for the S&P 500 and 10% for the NASDAQ. What’s weird, though, is that if we zoom in on the last few weeks, we see something odd.
A Quick Drop, and an Incomplete Recovery
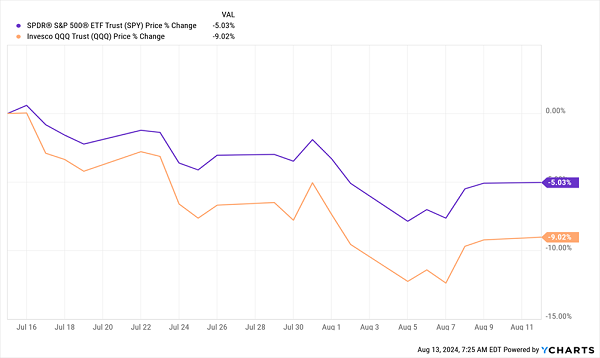
The NASDAQ (the benchmark ETF for which is in orange above) fell by more than 10%, and the volatility we saw in that period rose at the sharpest rate since the pandemic. It was even greater than the 2008/’09 financial crisis.
This chart only captures opening and closing prices, so it’s hard to see exactly how dramatic this was, but let’s put it this way: at their lowest point during the selloff, stocks had erased all of their gains since January 19. That kind of decline is highly unusual.
So unusual that, of course, the market started reversing course, with stocks already back to where they were in mid-May, as of this writing.
This 5.8%-Payer Is Experiencing a Disconnect We Can Exploit
Of course, picking stocks in such a volatile period is challenging. That’s why we prefer to strategically buy discounted CEFs during selloffs like these instead.
I’ve written a lot over the last couple of years about how unusually discounted CEFs are, and that’s still true today.
The Gabelli Dividend & Income Fund (GDV), for example, has a 14.2% discount to net asset value (NAV, or the value of its stock holdings) and a 5.8% dividend yield. It also holds a solid mix of large and small value-oriented stocks. Mastercard (MA), American Express (AXP) and Eli Lilly & Co. (LLY) are top holdings.
GDV’s Sudden Divergence
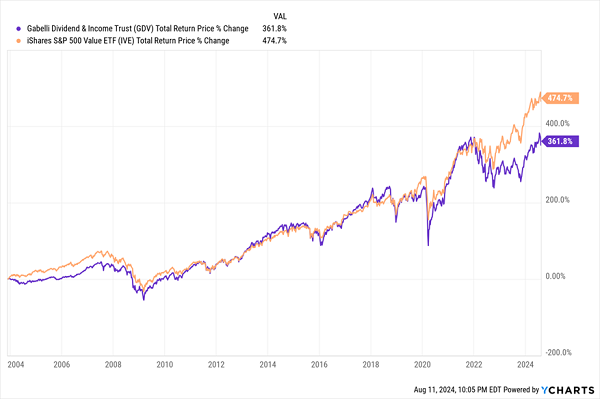
That discount is particularly interesting now because GDV’s market price has tracked the iShares S&P 500 Value ETF (IVE)—a good benchmark for the fund—on a total-return basis for a long time. But in the last two years, a lack of investor enthusiasm has caused GDV to lag.
GDV’s Bigger Discount
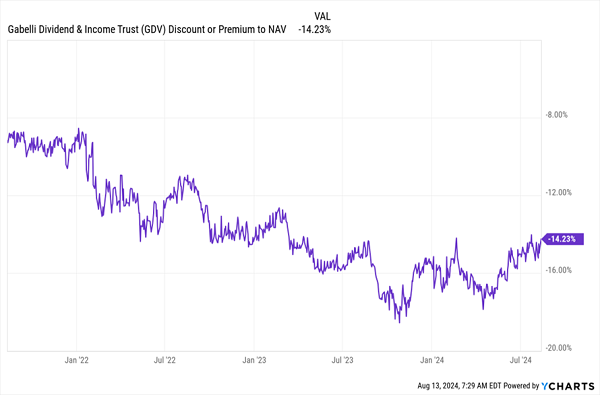
This is an entry point for savvy contrarians, and what’s happening here isn’t unique to GDV. Higher volatility is making many equity CEFs cheaper on a market-price basis, even as their underlying assets keep growing. If this volatility keeps up, CEF investors who reinvest their big dividends will get some terrific entry points going forward, too.
29.8% Returns From “Boring” Income Funds? It’s Possible. Here’s How.
Here’s the funny thing about GDV: While most folks would say its 5.8% dividend is high, it’s actually pretty “meh” for CEFs!
The 4 CEFs I’m urging all investors to buy now illustrate this well: They pay 9.8% average dividends, more than 7 times the 1.3% you’d get from the typical S&P 500 stock. And they’re so cheap (thank you, selloff!) I’m calling for 20%+ price gains in the next 12 months.
Add those forecast price gains to that sky-high payout and you could be looking at a 29.8% total return here. Heck, even if I’m wrong and these 4 funds simply move sideways, you’re still beating the S&P 500’s historical annual return (around 8%, depending on the timeline you use) in dividends alone!
The time to buy these CEFs is now, while they’re still cheap. Click here and I’ll tell you more about them and give you the opportunity to download a free Special Report naming each one.