“I have no clue what to do,” said a friend recently over backyard beers. “On the one hand, stocks are still rising. On the other, everything is pricey.”
I know you’re feeling my buddy’s pain—I get similar sentiments from readers of my Contrarian Income Report service all the time.
The last few weeks of wild swings sure don’t help. No doubt your finger has hovered over the buy button but you’ve hesitated, worrying you’re getting in at the top.
That’s understandable: no one wants to be the last buyer in a bull market!
Let the Market’s “Fear Indicator” Guide You to Big Gains (and Dividends)
The solution to this dilemma is a strategy only a contrarian could love—we’re going to navigate by the VIX—the market’s so-called “fear indicator.”
You’ve probably seen the VIX on financial news sites. It’s a barometer of how options traders see market volatility playing out over the next 30 days. It’s pretty simple: VIX up, stormy weather ahead; VIX down, calm seas.
Here’s the thing, though: Most people take this literally, buying as the VIX falls (and sentiment calms down) and selling as it (and panic) rises. Too bad this is precisely the wrong way to play the VIX; it’ll cost you money every single time!
Look at this chart:
Buy on Fear—Because the Crowd Is Always Wrong
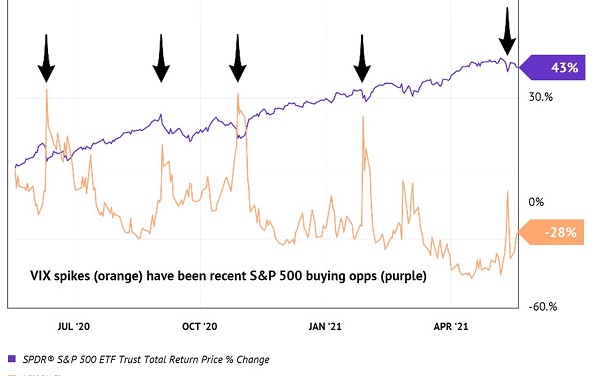
As you can see, every time the VIX (in orange) spikes, the S&P 500 (in purple) jumps soon after. Look at the end of that chart: you can see that the VIX has been moving up again (on recent inflation-related terror), but the market hasn’t (yet) responded.
That means our buy window is easing open again.
Meantime, history shows us that June, July and August are typically strong months for the stock market. So buying the dip now, in late May, makes sense.
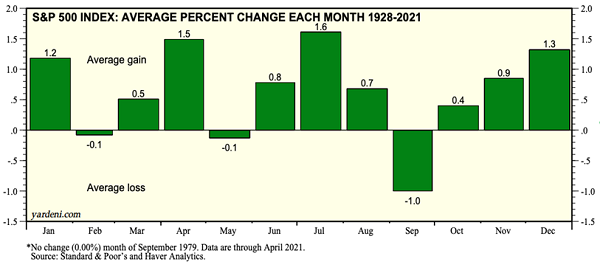
Source: Yardeni Research
Your Best Move: Buy Dividend Payers When the VIX Pops
You can buy extra insurance through stocks throwing off high, steady dividends. Because no matter what happens in the market, you can simply buy, bide your time and collect your healthy payouts.
To show you how potent buying a high dividend against a surging VIX can be, let me take you back to April 14, 2020, when the pandemic was hitting full force and the “fear gauge” was at 38, down from the wild level of 76 it had hit at the depth of the crash but still at levels we hadn’t seen in nine years.
That prompted us contrarian dividend hunters to get greedy. With the VIX overheating and oil prices in free-fall (and indeed just a week before crude tumbled into negative territory), my Contrarian Income Report subscribers and I followed our instincts and picked up … an oil and gas stock.
This sounds kind of crazy, but it was less risky than it looked because we had history and a reliable dividend on our side.
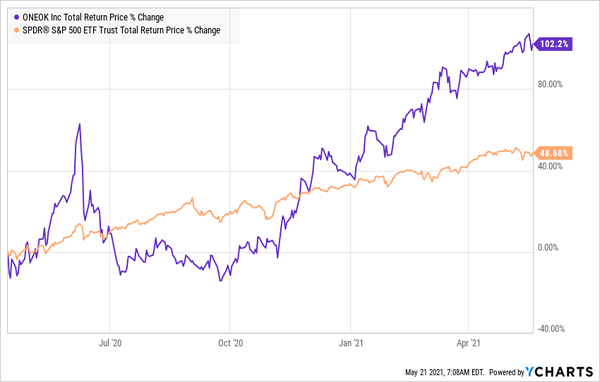
How Fear Drove a 102% Gain
The stock in question was ONEOK (OKE) a pipeline operator that moves natural gas and natural gas liquids from high-producing regions like the Permian, Williston and Powder River basins.
We couldn’t resist OKE because the crash depressed its share price so much that its dividend hit an incredible 11.8% (because prices and yields move in opposite directions).
The plunge was way overdone, because OKE’s management knew how to navigate a crisis: they’d been pumping out steady—and rising—dividends since the early ’90s, including some healthy raises in recent years:
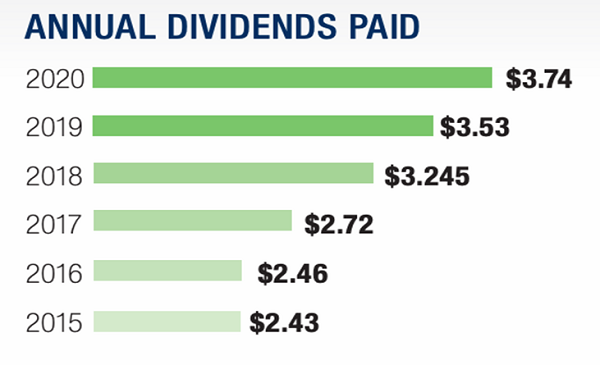
Source: ONEOK investor fact sheet
(Another nice thing about OKE is that it’s not a master limited partnership, or MLP, like most other pipeline operators. That means you get a simple 1099 form at tax time, rather than the much more complicated K-1 MLPs issue.)
In other words, our OKE buy ticked all three of our boxes: we bought during an elevated VIX, with a yield near all-time highs and OKE boasted a strong record of dividend growth.
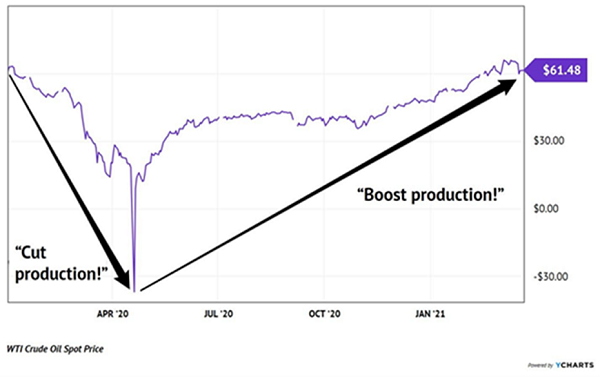
There was more, too: oil was at the outset of its highly predictable “crash ’n’ rally” pattern, which last unfolded from 2008 to 2012:
Here’s how it typically plays out:
- First, demand for oil evaporates due to a recession. Oil prices crash.
- Next, energy producers slash costs and production.
- The economy recovers. Energy demand picks up.
- But there’s not enough supply! So oil prices climb.
- Energy producers bring supply back online, but it takes time to explore and drill. Supply lags demand for years, and the price of oil climbs and climbs.
Even now we’re still early in this latest crash ’n’ rally pattern. We should assume that oil prices will keep climbing for the next two or three years at least—and rising prices and stronger demand will keep OKE’s pipelines full.
Oil’s “Groundhog Day” Pattern Repeats
All these factors: a high, historically stable dividend, a panicked market and a 100%-predictable trend in oil prices drove us to a 102% total return from OKE in just the last year, more than double the market’s gain.
OKE Racks Up a Fast Double
That turns the conventional “wisdom,”—which says we can have a high yield or strong growth in one stock, but not both—on its head. And it shows the power of investing against the crowd.
My New Portfolio Can 4X Your Dividends—and “Inflation-Proof” Your Nest Egg
My “Perfect Income Portfolio” is built on contrarian moves like this, but its biggest advantage is its dividend: the stocks and funds in this unique portfolio throw off payouts that are likely bigger than the income you’re bringing in now.
In fact, I’d be willing to bet that they’re a lot bigger—like 400% bigger!
The stocks and funds in my “Perfect Income Portfolio” also pay you a smooth (and predictable) income stream and hold their own through all market weather: inflation, deflation, boom, bust, you name it.
Now is the time for us canny contrarians to pick up these income generators, so we can start collecting their huge (and often monthly!) payouts right away. Click here and I’ll give you a complete guided tour of this dynamic income portfolio.