“Those are some crazy numbers.”
An old friend had messaged me, and that line caught my attention. As it turned out, he had 36 trillion numbers in mind: the national debt, in other words. That is a pretty striking figure, and it’s fair to ask how the country’s debt could go from a trillion dollars back in 1981 to 36 times that today.
“Very irresponsible, imo,” my friend wrote.
This sounds like a reasonable response, and many people think this way. But the problem here, from an investment perspective, is that most people look at the debt on its own, without considering the many other factors we’re going to delve into today.
My quick take: The rising US government debt load is not a good reason to avoid stocks, or, in our case, the 8%+ yielding closed-end funds (CEFs) that hold our favorite stocks. I’m talking about funds holding strong blue chips that form the backbone of the country’s economy, like Visa (V), JPMorgan Chase & Co. (JPM) and NVIDIA (NVDA).
Beyond Alarmist Debt Headlines
Now it is absolutely true that too much debt is unsustainable, and the US government isn’t accountable for this debt—we taxpayers are. But there’s more to the story than this.
In 2017, total government debt hit $20 trillion. That, by the way, was the last time I wrote in-depth on this topic. I still feel the same way I did then: that the US government is actually financially healthier than the average American.
That’s because then, as now, people tended to look at the debt in isolation. But the US government has plenty of tools it can use—and trends working in its favor—that make it easier to manage its debt than many people think.
Let’s start with a key number: the amount of revenue the government collects in a year through taxes and other fees.
Today, as in 2017, about 18% of US GDP goes to the federal government. That’s $5.2 trillion, at the current size of the US economy. Looked at another way, if Uncle Sam were to divert all of that revenue to paying off the debt (which is impossible, obviously, but stick with me for a second), he’d do so in about six-and-a-half years.
Here’s the key point, though: That six-and-a-half years is only slightly higher than the six years it would’ve taken in 2017. And let’s not forget that we had a pandemic in there, which caused a big spike in public debt.
So, viewed that way, government debt has remained about as manageable as it was eight years ago, and it would likely be more manageable if COVID hadn’t come along.
Now let’s go one step further and stack up debt and GDP growth:
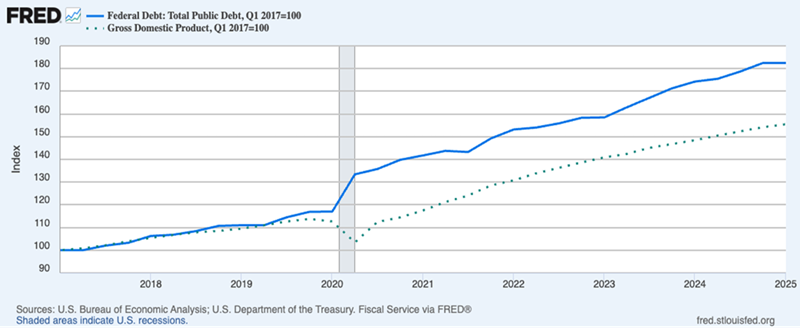
Both federal debt and GDP were growing at almost the same rate before the pandemic, which, as we just discussed, caused a bump in debt. And, of course, GDP took a hit then, too, with the economy in lockdown. As a result, GDP has grown about 55% in the last eight years or so, while total debt has grown about 80%.
Obviously, this means America’s debt-to-income ratio is worse than it was before the pandemic. But that’s not because of a structural issue. We can point at the pandemic as the main cause here.
Still, a one-time hit could be trouble in the long run, right? Sure, but look at this chart.
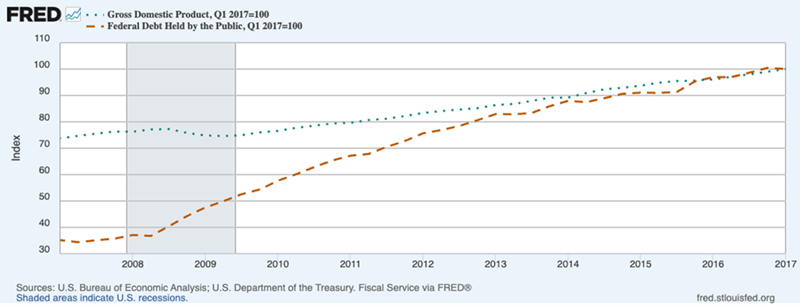
The extra government debt due to the COVID-19 crisis looks bad because the numbers are huge, but if we compare it to the bump, and continued accelerated rise, in indebtedness sparked by the 2008/2009 financial crisis, the 2020 debt increase is rather small, as you can see below.
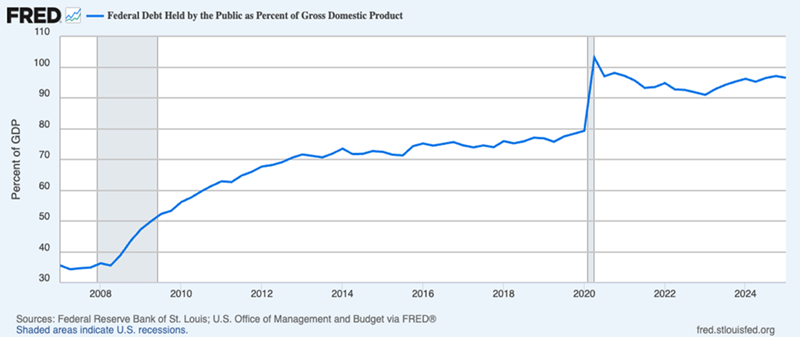
Before 2008, the ratio of US public debt to GDP was around 35%, and in less than five years, it doubled to 70%, where it remained until the pandemic, after which it went above 100% before falling to 96%, where it is now.
On a relative basis, the jump in 2008 was clearly worse than in 2020. Yet America survived just fine. So there’s no reason to worry, unless and until this chart changes direction.
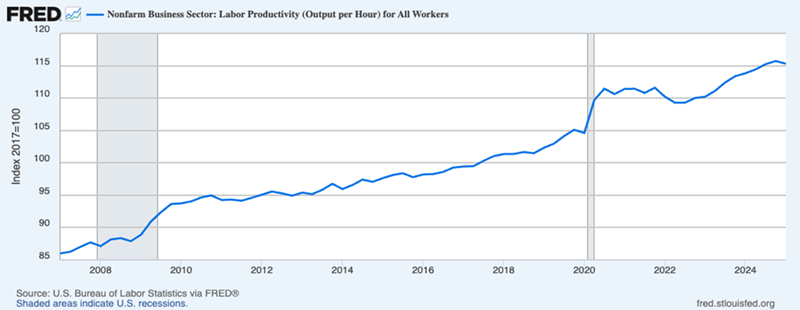
Above is the real story: labor productivity. It’s risen by a third since 2007, meaning Americans now produce about $1.33 in value for every dollar they produced back in 2007. And note how that’s been a pretty stable line upwards? America keeps producing more effectively and efficiently: This is progress, growth and prosperity. And now we have AI, which is likely to give productivity another boost.
This also explains why the S&P 500 has delivered 10.4% annualized returns over the last two decades, in line with the 10.3% annualized returns it’s delivered over the last century. And, yes, during that time, the federal debt grew, as did the US government’s income, thanks to higher US productivity producing higher GDP.
So if you’re thinking of cutting back on your US holdings due to the debt, remember these three things:
- US assets have risen alongside the debt.
- The pandemic caused debt to grow more than it would’ve otherwise, but that bump was relatively small compared to the debt increase sparked by the Great Recession.
- US stocks have soared even as the debt has risen.
Instead, now is the time to boost our holdings in the US, and doing so through CEFs yielding 8%+ is hands-down the best way to do it.
With CEFs, we get exposure to strong blue chips like the ones I mentioned earlier, often at a discount, since these funds’ market prices can—and often do—trade for less than the value of their portfolios. That’s our “discount to NAV” in CEF-speak.
Big dividends and big discounts from S&P 500 stocks. Try getting that from an index fund or by buying these stocks “direct.” It’s just not possible. And any fear—and hence bigger discounts—caused by overwrought debt worries just makes our opportunity even sweeter.
4 BIG (9.7%) Dividends to Cash in On This Debt “Crisis,” AI’s Surge
As I just mentioned, we’re not losing sleep over America’s debt because labor productivity keeps rising—lifting government revenue along with it.
And as I also mentioned a second ago, thanks in part to artificial intelligence, workers are going to produce more, and faster, as we move ahead.
That tells us two things:
- We’re still early in the AI boom.
- The big winners won’t just be the NVIDIAs. In fact, I see the everyday insurers, banks and even manufacturers, who are using AI to boost profits, as the biggest beneficiaries of the AI boom.
I’ve uncovered 4 funds that own shares of top AI developers and adopters. They’re bargains now, and they pay massive dividends: 9.7% on average.
When you see these 4 funds, I think you’ll agree that they’re the perfect buys for the times we’re living in. Click here and I’ll tell you more—and give you a free copy of a Special Report revealing these 4 funds’ names and tickers.