We contrarians love a good panic. Dividends are on sale!
The closed-end fund (CEF) aisle is where we do our best bargain shopping. Wall Street ignores CEFs, creating obscurity that we feast on. Discounts, mispricings and high yields are here.
Why the bargains? CEFs routinely go on sale. Thanks to their low profiles, supply and demand imbalances routinely disconnect a CEF’s price from its underlying assets.
When the value swings heavily in our favor, we buy.
And we have some dandy discounts now, with some big divvies attached! These five yields have soared to levels between 6.3% and 12.9%.
Plus, they are trading at discounts up to 12%. Which means we can buy these assets for as little as 88 cents on the dollar.
General American Investors (GAM)
Distribution Rate: 10.8%
General stock-market volatility is likely to draw out some of that inefficiency I just mentioned, so let’s start with a couple broader-market funds.
General American Investors (GAM), for instance, is a large-cap growth CEF that has more than a quarter of its assets invested in the banged-up tech sector, as well as double-digit exposure to the reeling financial and consumer discretionary sectors. Top holdings such as Alphabet (GOOG), Microsoft (MSFT), and Berkshire Hathaway (BRK.A) have been down to downright dreadful so far in 2026.
While it targets growthier stocks, GAM is technically a “large blend” fund, so we can horse-race it against the S&P 500—and the fund’s managers aren’t afraid to, either. Here’s a look at the fund’s performance versus the venerable index through the end of 2025:
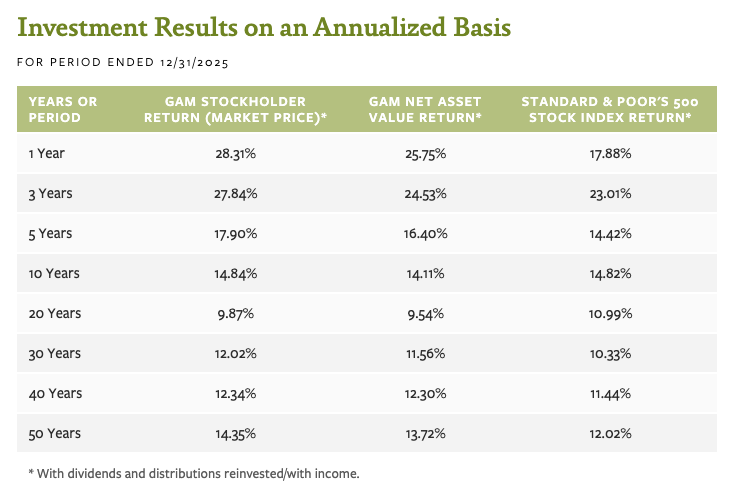
Source: General American Investors Fact Sheet
Consider this: Only about 10% of large-cap mutual fund managers have been able to beat the index over the trailing 15 years. GAM boasts a performance edge over the past half-century. That’s an enviable track record.
The real draw of General American Investors, though, is how we receive those returns. An S&P 500 fund today will only deliver a little more than 1% of its annual performance in the form of dividends; however, GAM’s distributions—which admittedly are taxed somewhat differently because of their makeup—would deliver closer to 11% based on today’s distribution rate.
But this is where we need to be careful about valuation. Yes, GAM currently trades at a discount of nearly 12% to its net asset value (NAV). In many cases, that would represent a screaming bargain—but over the past five years, GAM, on average, has traded at a 15% discount. So it’s a nominal deal, but a relative premium.
Liberty All-Star Equity Fund (USA)
Distribution Rate: 12.9%
A stock CEF with far better relative value is Liberty All-Star Equity Fund (USA)—the first of two 12%-plus yielders on my radar.
This is another “blend” fund, but unlike GAM, it tilts toward value. Its roughly 140 stock picks have been selected by five teams of managers—three value-oriented and two growth-oriented, reflecting its typical 60/40 value/growth split.
The top holdings include many of the blue chips names every large-cap fund seems forced to hold—Nvidia (NVDA), Alphabet, Microsoft—but it has also elevated names such as Capital One (COF), Charles Schwab (SCHW) and Fresenius Medical Care (FMS).
Like with GAM, the bulk of USA’s returns come from its massive distribution. Performance hasn’t been as good, but over the long term, Liberty All-Star Equity has been pretty competitive with the S&P 500. A modest amount of debt leverage (where the fund borrows money to invest even more in its pick) has generally led to amplified gains in up markets, but deeper dips in down markets.
But USA’s chart has gotten really interesting of late.
This Is a Big Deviation From Liberty All-Star Equity’s Norm
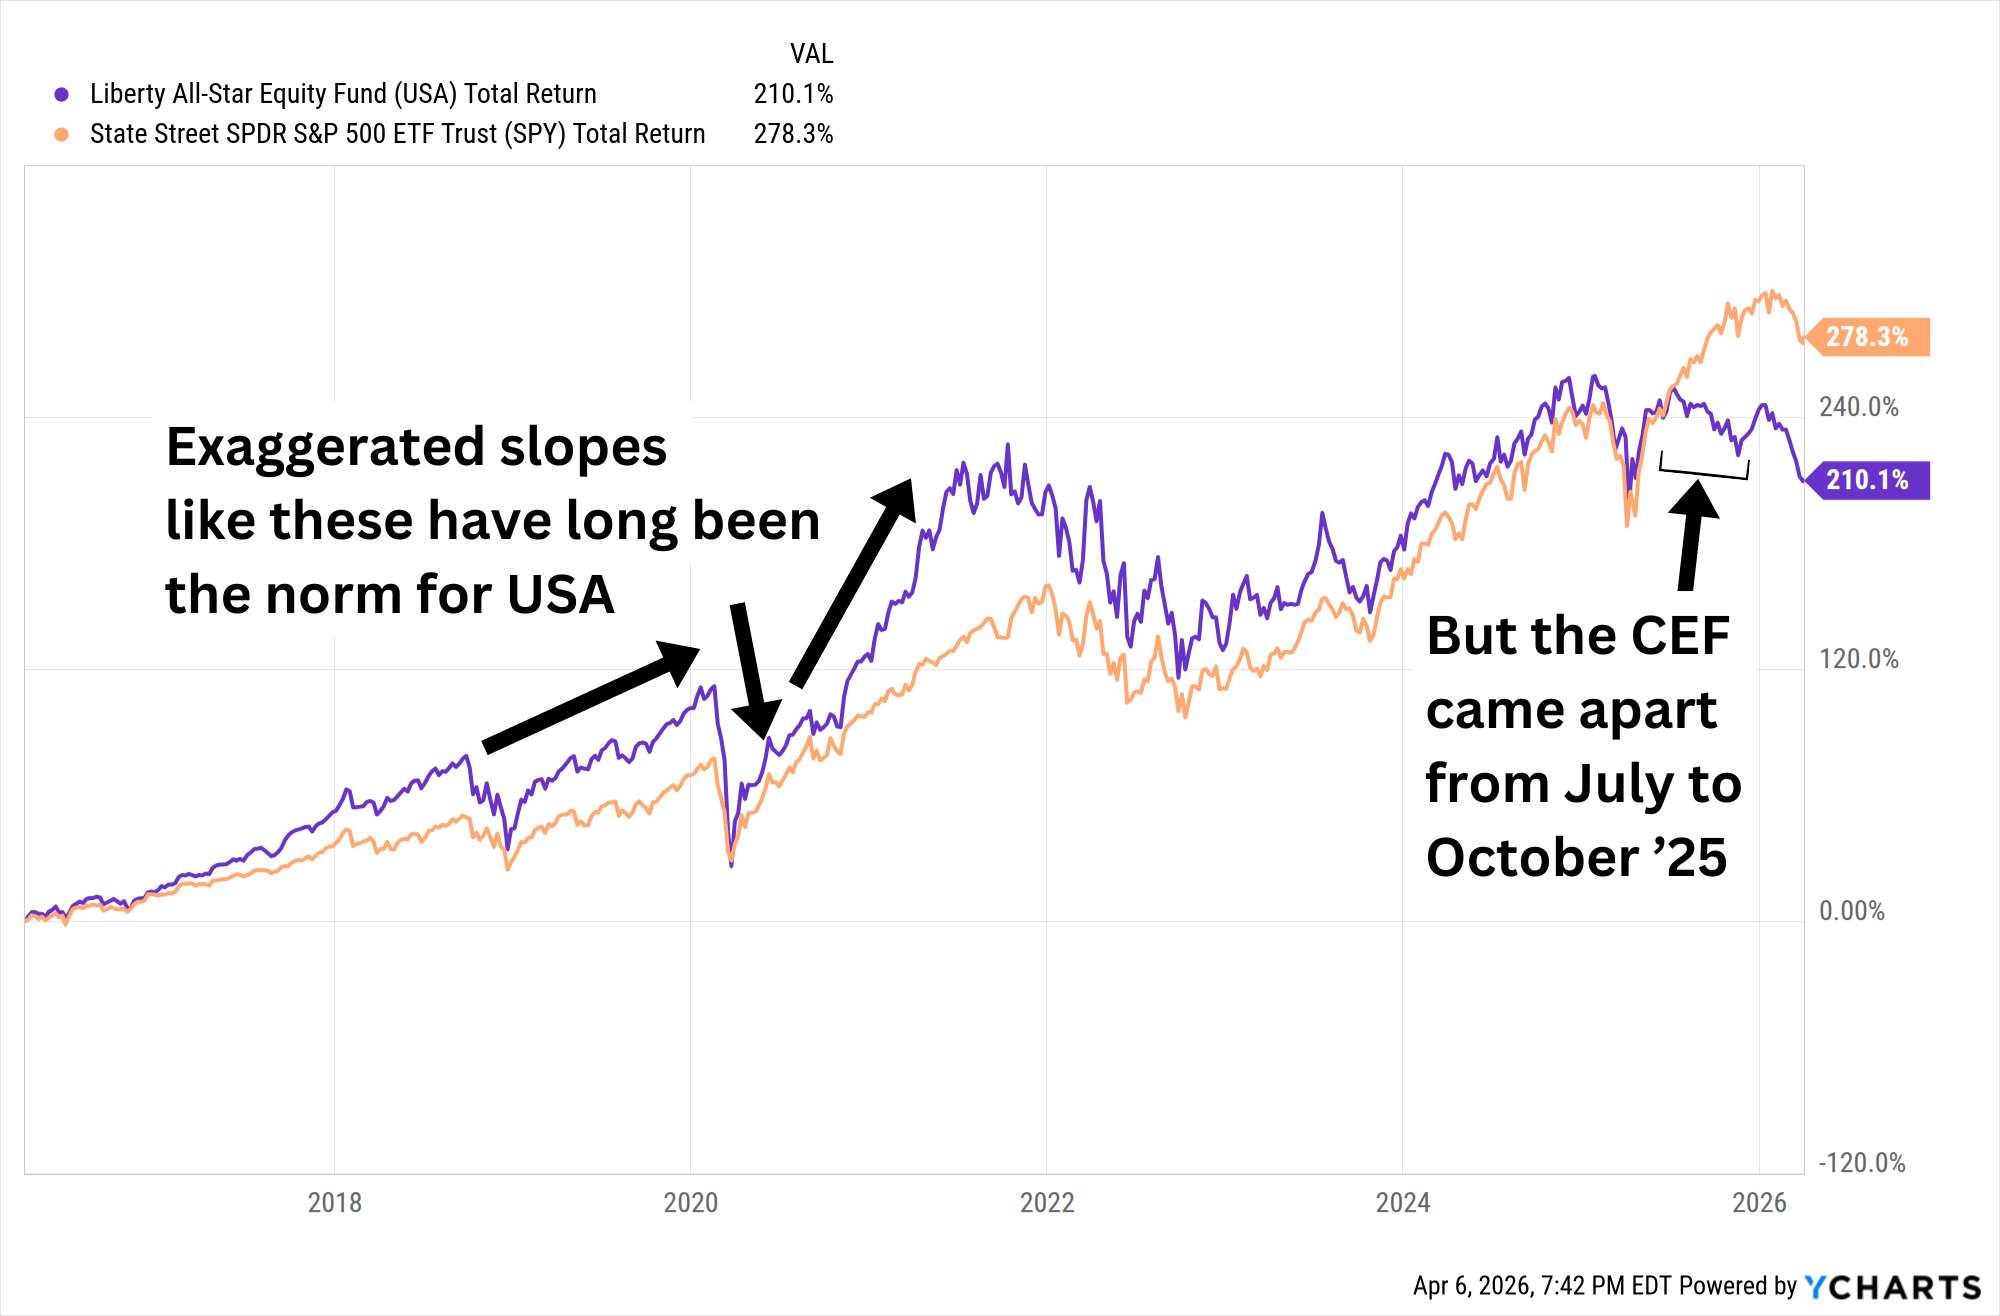
For a few months in the back half of 2025, USA seemed to completely disconnect from the market in a bout of severe underperformance. But part of that was an implosion in its valuation. USA has long traded roughly in line with its net asset value, but it’s currently trading at a 10% discount to NAV—about as big a sale as shares have offered in the past five years.
Calamos Strategic Total Return Fund (CSQ)
Distribution Rate: 8.4%
Let’s start to shift toward fixed income with the Calamos Strategic Total Return Fund (CSQ): a straightforward do-it-all CEF that owns both stocks and bonds.
Specifically, CSQ management is tasked with investing at least 50% of its assets in equities, and the rest in “convertibles and fixed-income securities deemed beneficial during periods of high volatility.”
But despite the current volatility, CSQ is plenty aggressive right now, featuring a roughly 65/35 blend of stocks and bonds. The equity side is about 115 stocks wide, concentrated in blue chips like Nvidia (NVDA), Apple (AAPL), and Eli Lilly (LLY). On the debt side, its 500-plus holdings include convertibles, corporate bonds, bank loans, and other fixed-income instruments.
It’s difficult to provide a long-term comparison against similar ETFs. That’s because most of the players in that space are global (read: U.S. and international) funds—like the iShares Core 60/40 Balanced Allocation ETF (AOR) illustrated below—while CSQ’s assets are virtually 100% U.S.-based. And historically speaking, domestic funds have a significant performance edge.
But long-term, CSQ’s stock-bond portfolio has been enough to even beat the all-stock S&P 500. That’s in part because CSQ’s liberal use of leverage, currently 30% as I write this, has helped super-charge bull-market returns.
But There Is a Tradeoff
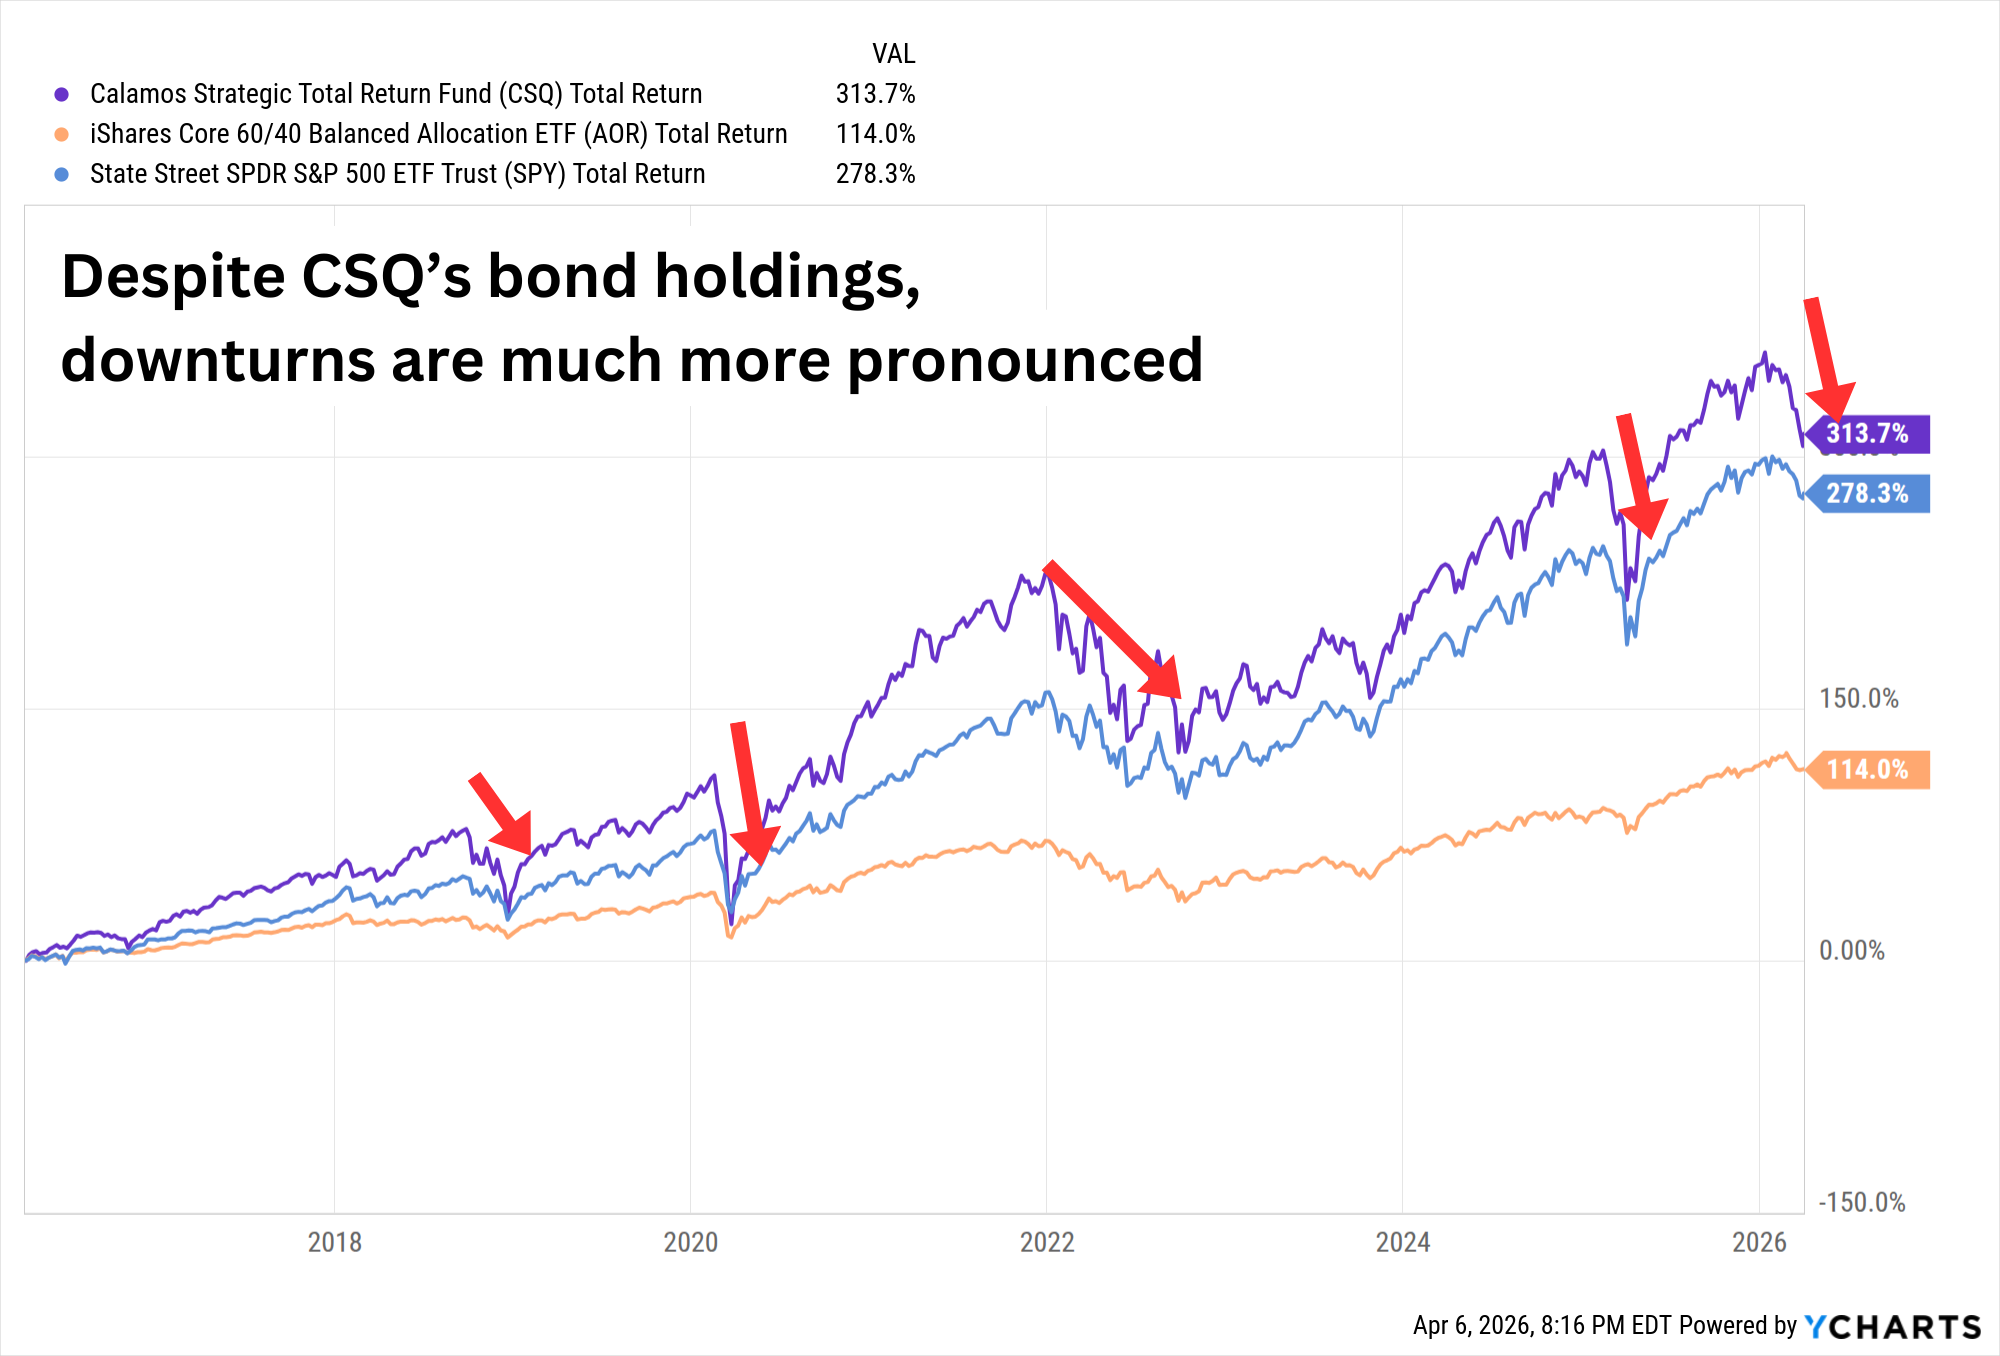
“Balanced” strategies are expected to have lower volatility than an all-stock portfolio because of the fixed-income holdings. CSQ, however, is a much wilder ride than the S&P 500, let alone plain-vanilla allocation funds.
On the plus side, Calamos Total Return prioritizes a consistent monthly distribution—indeed, the payout has changed just five times since 2011, and all of those changes (including the most recent one, in 2026) were raises.
But perhaps the biggest deal is the big deal we’re getting on CSQ right now. The fund typically trades about 1% to 2% below its net asset value (NAV). Today? Its 10% discount means we’re paying 90 cents on the dollar for this broad portfolio.
BlackRock Muniholdings (MHD)
Distribution Rate: 6.3%
We’re getting a similar discount from a much different portfolio in the BlackRock MuniHoldings (MHD), which owns about 900 tax-advantaged municipal bonds.
About the only places we’re getting a 6%-yield from ETF-land is junk funds and emerging markets strategies. But here, we’re getting fat monthly checks from high-quality municipal debt connected to transportation, utilities, health, housing, school districts, and more. Some 80% of assets are investment-grade, and the majority of that is in bonds rated AA or above.
By the way, that yield is even better than the headline figure indicates. Remember: Muni income is exempt from federal taxation, and sometimes state and local depending on where the bondholder resides. MHD’s distribution isn’t always entirely made up of tax-exempt income, but off the cuff, someone in the highest (37%) tax bracket who also pays NIIT (3.8%) would likely need a yield of around 8.5% from taxable bonds to get the same amount of take-home income.
This isn’t necessarily a defensive income haven, however. The bulk of MHD’s holdings are also on the very long end of the maturity spectrum, with 70% of assets invested in bonds that mature in 20 years or more. Tack on a moderate amount of debt leverage, and we get a CEF that can really take flight—or careen into the ground. It all depends on the environment for munis.
It’s Better Than a Muni Index Long-Term, But Its Slumps Can Be Significant
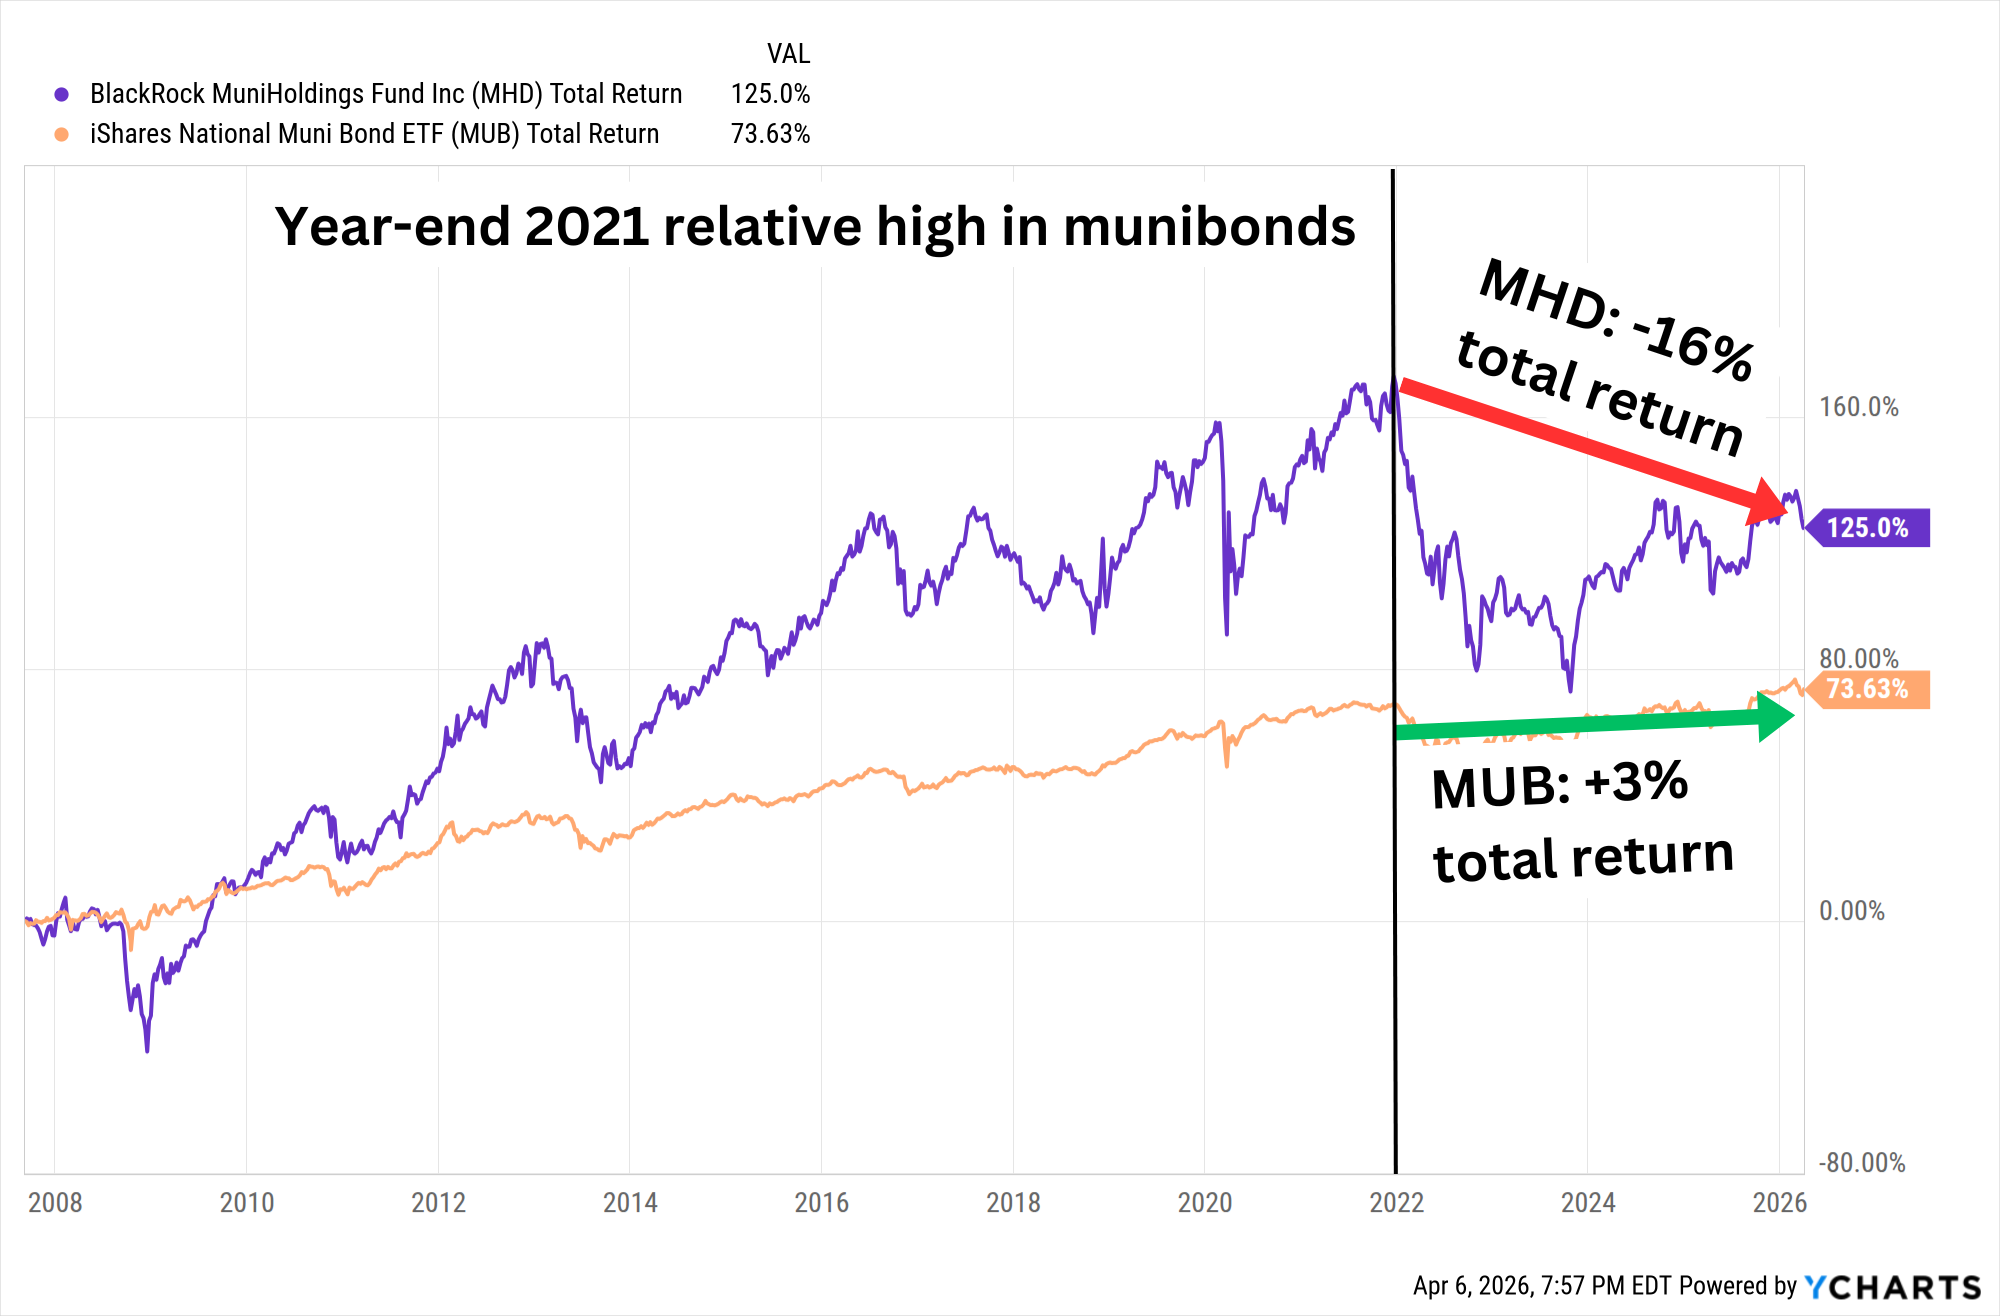
Unsurprisingly, it pays to pay attention to relative valuation. On that front, MuniHoldings’ almost 11% discount to NAV is nice, but it’s not very wide compared to its five-year average discounts of about 9%.
There’s also the open question of how the fund fares without its longtime helmsman. Walter O’Connor, who worked in municipal bonds for four decades and managed MuniHoldings for roughly half that time, stepped down in March 2026. He’s succeeded by five managers that joined between 2022 and 2023.
Nuveen Floating Rate Income Fund (JFR)
Distribution Rate: 12.8%
Another monthly-paying bond CEF, Nuveen Floating Rate Income Fund (JFR), is an extremely “junky” portfolio of about 425 corporate floating-rate bonds. Only a little more than 10% of assets are allocated to investment-grade bonds, and those are on the bottom tier of BBB. Another quarter is in junk’s top drawer (BB), and the biggest slice of the pie (about 50%) is in B-rated debt.
Between that and heavy leverage of nearly 40% as I write this, we’re looking at a bond fund that swings big and yields big.
Floating-rate bonds feature variable interest rates that adjust periodically based off a benchmark rate, so they’re generally less productive in declining-rate environments, but they offer protection against rising rates. Rates still seem likelier to head lower than higher over the next year or so, but that’s not the relationship I’m most interested in.
Near the end of 2024, I warned that JFR was trading near the historical high end of its price spectrum. My chart at the time:
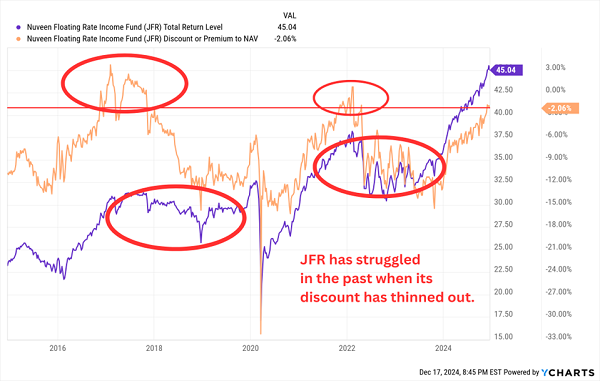
That thin discount yet again played out poorly for JFR.
But the Tables Are Turning in New Money’s Favor
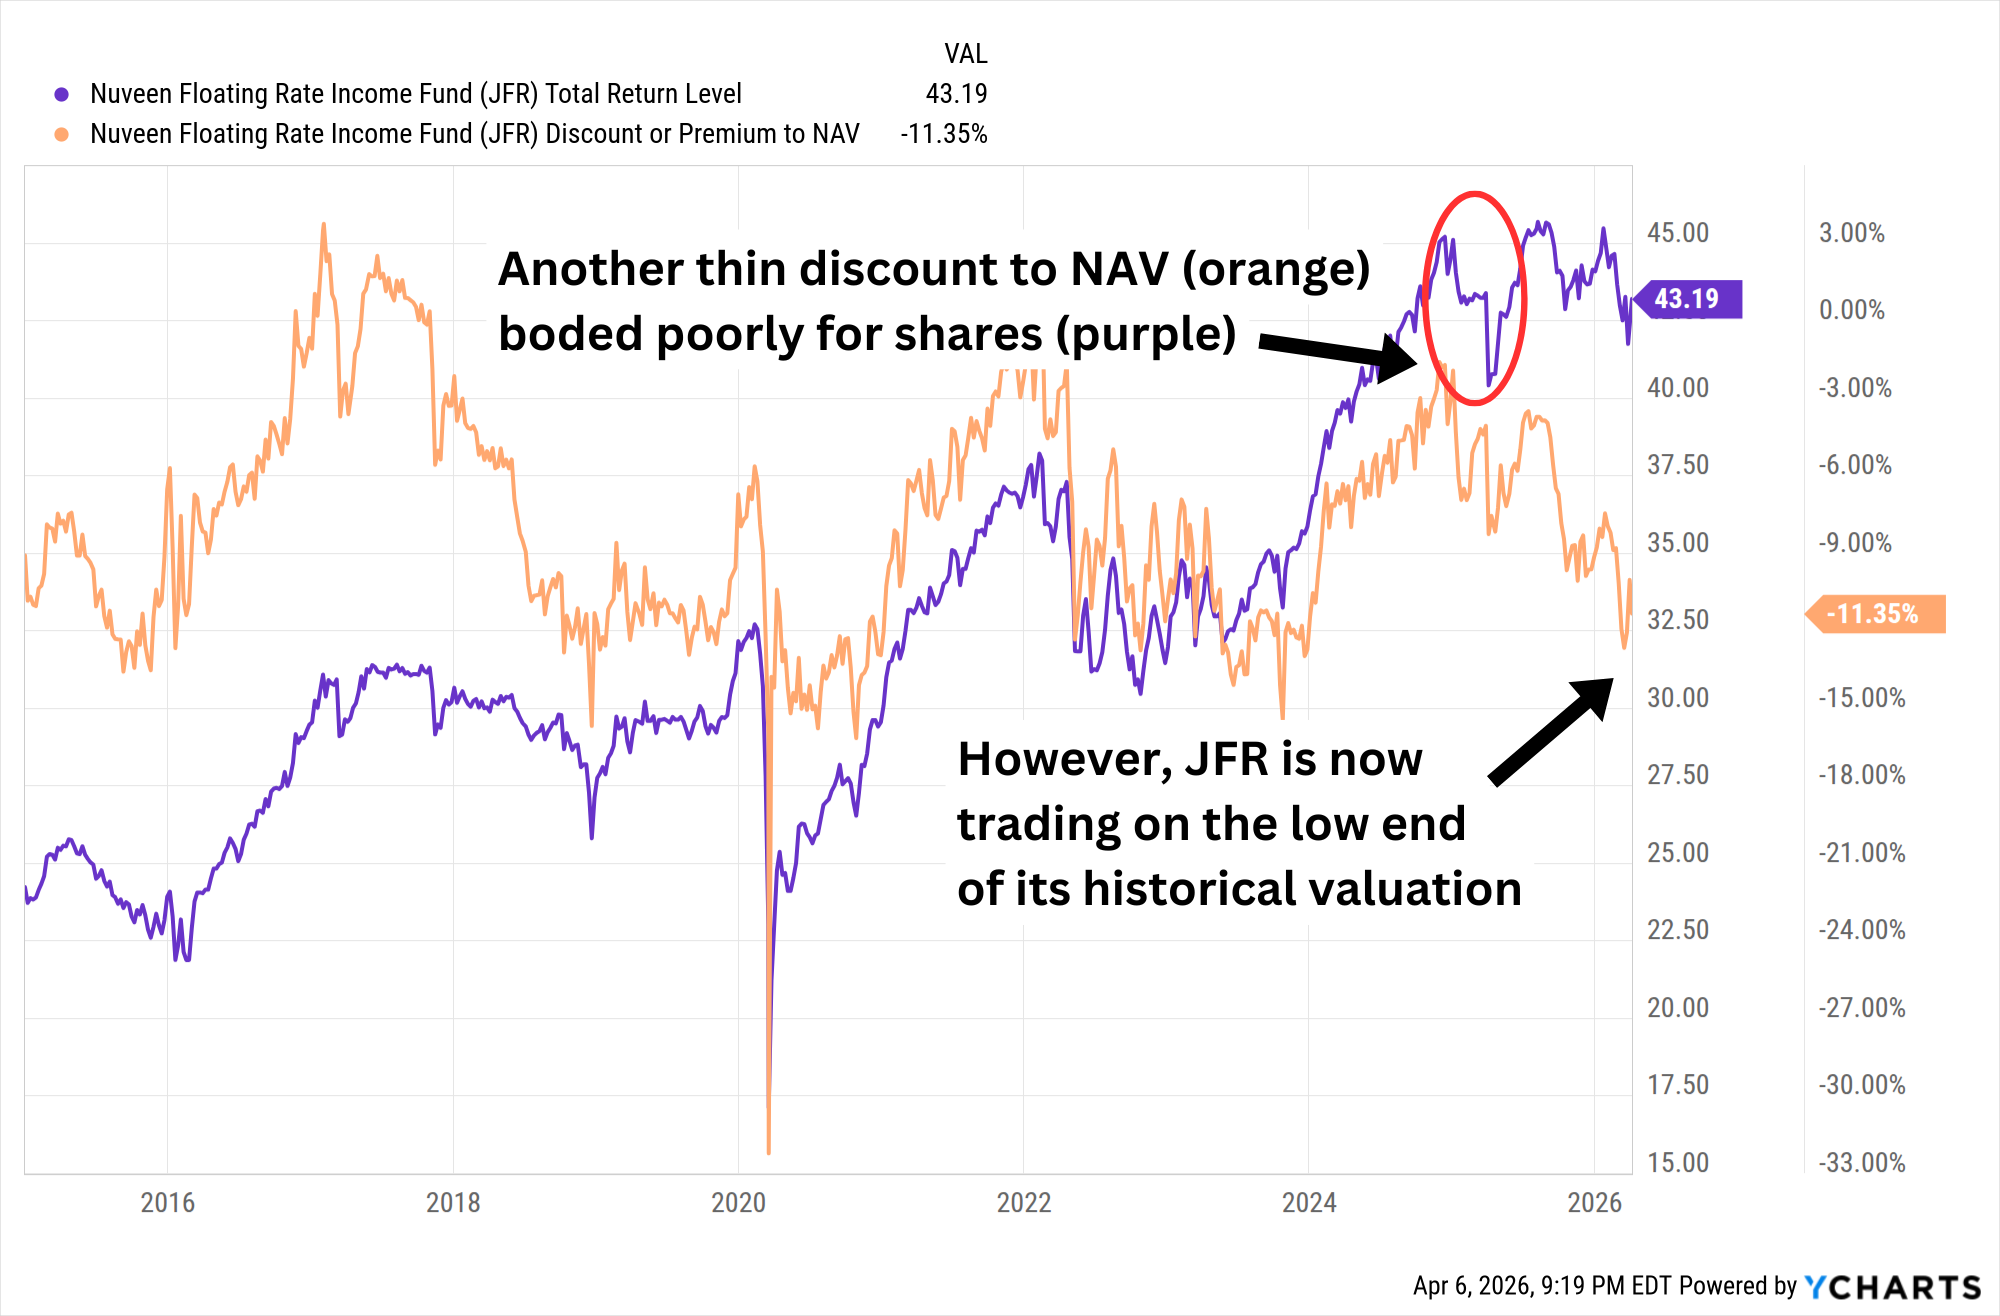
Nuveen’s floating-rate fund now trades for a 12% discount, so we’re getting these bonds at 88 cents on the dollar. That’s a good deal cheaper than the fund’s five-year average discount of about 7%.
2026 Is a Mess. My Favorite 11% Dividend Can Help You Clean Up.
But if I’m going to take a swing on a double-digit yield, I’d prefer to do it on a fund that won’t be swimming upstream against the Fed.
Right now, one of my favorite home-run dividends is a heavily diversified, brilliantly built bond portfolio that yields 11% but is also set up for stock-like gains.
This fund checks off just about every income box I can think of:
- It pays a whopping 11% in annual income!
- It has increased its dividend over time!
- It doles out special dividends on the regular!
- And it pays its dividends each and every month!
On top of that, Morningstar previously named this fund’s manager a Fixed Income Manager of the Year. He’s been inducted into the Fixed Income Analysts Society Hall of Fame, too.
That’s about as good a resume as we’ll find, and his fund will pay us $1,100 for every $10K we invest.
But the window is closing fast! Premiums on funds like these tend to rise as volatility ticks higher and as investors rotate out of growth stocks and into reliable sources of income like this. I don’t want you to miss your chance. Click here and I’ll introduce you to this incredible 11% payer and give you a free Special Report revealing its name and ticker.