The Fed is cutting, and that’s bullish for preferred stocks and their big payouts. Let’s look at a trio yielding up to 9.8% that will benefit from every ease from Mr. “Dead Man Walking” Jay Powell.
Most vanilla investors know common shares—and stop there. They buy banks like Bank of America (BAC) or Wells Fargo (WFC) by typing “BAC” or “WFC” into their brokerage account.
Financial firms also offer preferred shares with much bigger payouts. All we need to do is keep typing.
Preferreds are part stock, part bond. These hybrids trade on regular exchanges under normal tickers. They pay dividends and represent ownership, but their income stems from “bond” DNA.
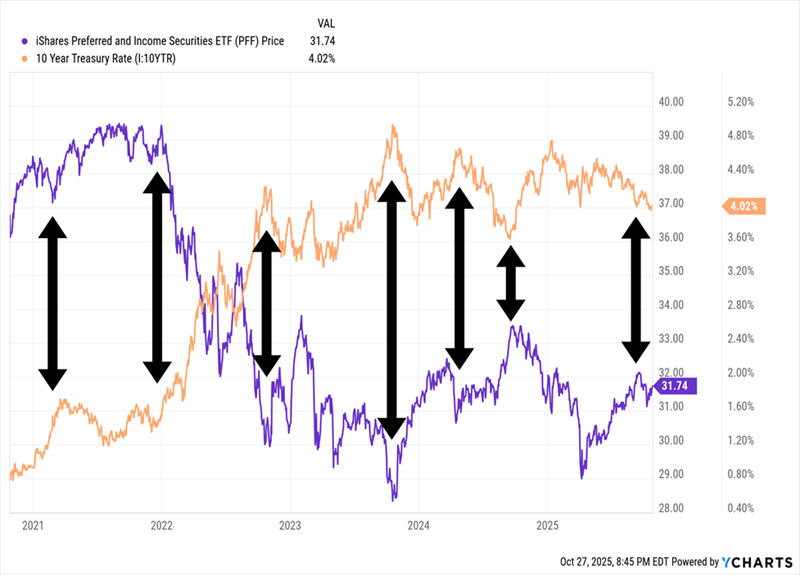
Because of that, preferreds often trade like bonds. That’s why they shine when rates fall.
Preferreds Shine When Interest Rates Fall
Buying individual preferreds is a hassle, however. Their tickers are alphabet soups. Plus, we need a basket of them for diversification.
Enter closed-end funds (CEFs), which can employ leverage to juice their portfolios (and payouts) by an extra 10%, 20% and even 30%. These CEFs can, and often do, trade at discounts to their net asset values (NAVs). That makes them nice one-click buys for those of us who have actual lives.
Let’s discuss three preferred funds dishing divvies between 7.2% and 9.8%. And oh by the way, these funds pay monthly.
Cohen & Steers Limited Duration Preferred and Income Fund (LDP)
Distribution Rate: 7.2%
A steady 7.2% payer, Cohen & Steers Limited Duration Preferred and Income Fund (LDP) is a diversified bucket of 260 preferred payers from financial-sector stocks such as Goldman Sachs (GS) and Citigroup (C). It’s also global in nature, meaning U.S. companies are only part of the formula—50%, in fact. The other half of assets come from companies located in Canada, the U.K., France and a handful of other, predominantly developed markets.
What makes LDP different is its focus on “duration.”
Duration is a metric of interest-rate risk, typically measured in years, that’s applied to bonds and fixed-income instruments such as preferreds. The calculation, which involves the value of cash flows, compounding periods and more, is a lot to explain here. But the oversimplified explanation goes like this: If a fund had a duration of 5 years, that would imply a 1-percentage-point increase in market interest rates would cause the fund to decline 5% over the short-term, and vice versa—a percentage-point decline in rates would lift the fund by about 5%.
Managers Elaine Zaharis-Nikas, Jerry Dorost and Robert Kastoff aim to invest in preferreds with lower overall duration, specifically aiming for a fund duration before leverage of less than 6 years. Now, the CEF’s average modified duration of 6.6 comes in just ahead of both that goal, as well as the category average for all preferred funds of 6.56. But that duration reading includes the effects of very heavy debt leverage (33% currently).
And here’s what that portfolio gets us:
Powerful Preferred Outperformance Over Time
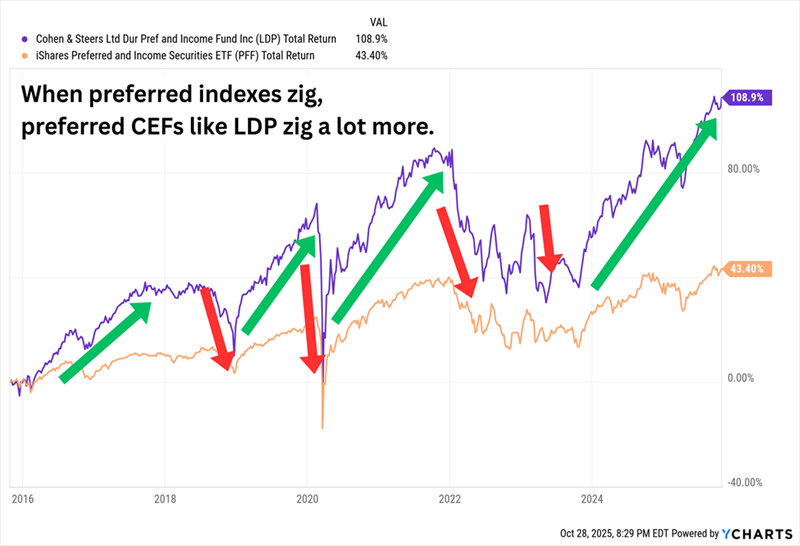
The use of leverage also means LDP’s performance will be exaggerated in both directions compared to basic index funds. That has worked out over the long term, but it can make for some drastic drops. Timing becomes much more important when deciding whether to jump into highly leveraged CEFs.
A reminder: Closed-end funds tend to trade at either discounts or premiums to their net asset value (NAV), so it’s sometimes possible to buy assets through CEFs more cheaply than we could on their own. Right now, for instance, LDP trades at a modest 3.5% discount to NAV—but over the past five years, LDP has averaged a discount of closer to 4.5%. So it’s cheap on a nominal basis, but relatively pricey from a historical perspective.
John Hancock Preferred Income Fund III (HPS)
Distribution Rate: 8.6%
John Hancock Preferred Income Fund III (HPS) cranks up leverage to 37%, boosting its yield (8.6%) but also its volatility. HPS is the spicy option on our preferred menu today.
HPS’s four portfolio managers’ strategy is pretty simple: Own a basket of preferred stocks with at least 50% exposure to investment-grade preferreds, from a variety of sectors. Right now, about 55% of the 161-stock portfolio is investment-grade in nature, and the lion’s share of that is rated BBB (the lowest tier of investment-grade debt). The same percentage of assets is allocated to traditional preferreds; most of the rest is in convertible preferreds.
Financials unsurprisingly lead the way, but at 60% of assets, they’re not as prominent as they are in competing funds. U.S. preferreds dominate the portfolio, too, at a nearly 90% weight.
Leverage is even higher in HPS, at 37%.
And That Leverage Works to the Fund’s Advantage … In Spurts
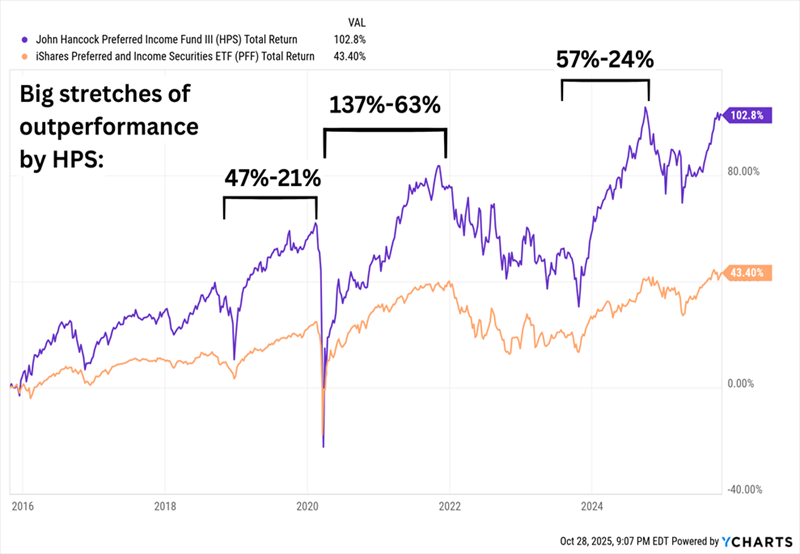
However, it’s a more volatile fund over the long run, at a beta of 1.19 vs. 0.74 for PFF.
Valuation is a problem, though. John Hancock’s preferred funds often trade at a premium, and that’s the case here, with HPS trading at a 6% premium that’s even wider than its historical long-term premium of 4%.
Nuveen Preferred & Income Opportunities Fund (JPC)
Distribution Rate: 9.8%
Nuveen Preferred & Income Opportunities Fund (JPC) delivers a nifty 9.8% dividend with 80% investment-grade quality—making it the best blend of yield and safety we’re discussing today.
Managers Brenda Langenfeld and Douglas Baker manage a global portfolio of about 260 preferreds, only a little more than half of which come from U.S. firms. Top holdings are a split of U.S. financials like JPMorgan Chase (JPM) and Truist Financial (TFC), and international sector names like Barclays (BCS) and HSBC Holdings (HSBC).
Management maximizes possible exposure to their picks by utilizing debt leverage in the high 30s, which results in another PFF-pounding performance:
JPC’s Returns Versus HPS and JDP
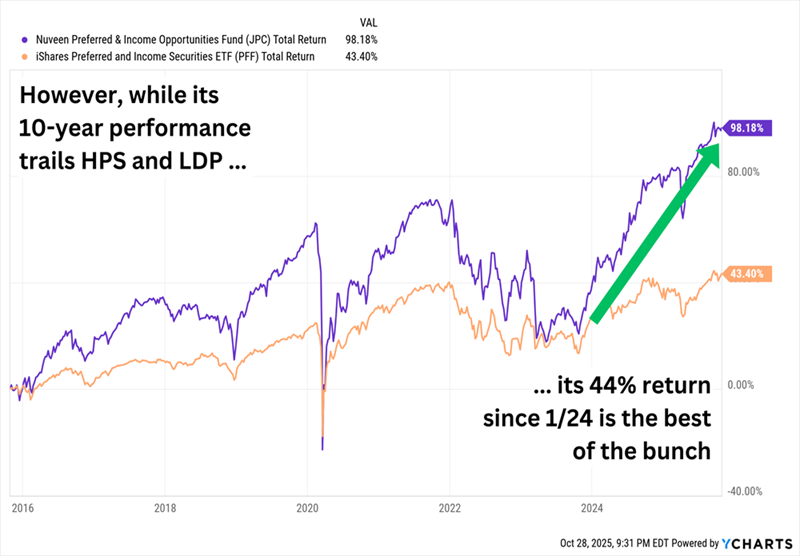
The good news? JPC, by beta, is relatively stable compared to many other preferred funds. The bad news? Performance is a little muted, at least versus the aforementioned funds.
While Wall Street chases Powell’s next sound bite, we’ll collect these monthly payouts (up to 9.8%) instead.
A Fully Paid Retirement on Just $500,000?!
And yes, funds like these can help us retire on dividends. In fact as we speak, several of the picks in my 9% Monthly Payer Portfolio are still trading within my “Buy” range.
The virtue of a sky-high-yield portfolio is really easy to see with some simple math:
- A $500,000 nest egg earns $45,000—depending on where you live, that could be enough for a fully paid retirement on its own.
- A $750,000 nest egg pays a $67,500 annual dividend “salary.”
- And if you have managed to stow away a cool million bucks, the 9% Monthly Payer Portfolio could pay you an equally cool $90,000 in dividend income every year.
And remember: These dividend dynamos are paying us monthly.
That means no complex accounting, no building “dividend ladders.” Just nice, even payouts delivered to us on the exact same schedule we pay our bills.
It’s like getting a regular salary—without the job!
Don’t miss out on my favorite income plays while you can still get in at bargain prices. Click here for details and turn your portfolio into a monthly dividend machine.