We’re a little more than halfway through the year now, so it’s a great time to check the state of play on our favorite high-yield plays: 8%+ paying closed-end funds (CEFs).
And what a half-year it’s been: CEFs have posted returns far bigger than most people expected back in January! And I see more gains ahead.
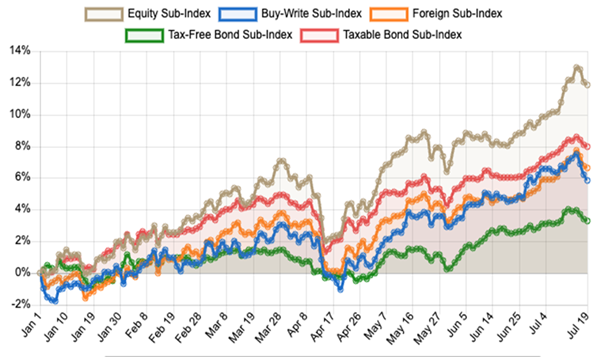
Source: CEF Insider
Truth is, the hundreds of CEFs tracked by my CEF Insider service are turning up some fascinating data, especially if we zoom into the CEF Insider Equity Sub-Index (in brown above), which has returned 12% year to date, as of this writing.
That’s much more than the 8.5% we’d expect for the entire year, based on the average long-term return for the S&P 500.
If you’re a long-time reader and have been buying CEFs, congratulations: You’ve likely grabbed a share of that healthy return. Keep at it! If you’re on the sidelines and worried that you’re too late, keep reading because that couldn’t be further from the truth.
Let’s start with a simple question: What can we expect if we invest in stocks now—or better still, high-yielding equity CEFs, which we’ll get into more in a moment? Let’s look at the history.
Long-Term Stock Investors Booked Big Gains
Before we go further, let’s break down that 8.5% long-term average annualized return the S&P 500 has delivered. This is going back over many decades of stock investing in America, including downturns like the Great Depression, the dot-com crash, the 2008/2009 financial crisis, the pandemic and the instability that’s followed it.
Throughout all of that, stocks returned about 8.5% per year, on average—and those gains have been accelerating in recent years.
Stocks Unlock Long-Term Wealth
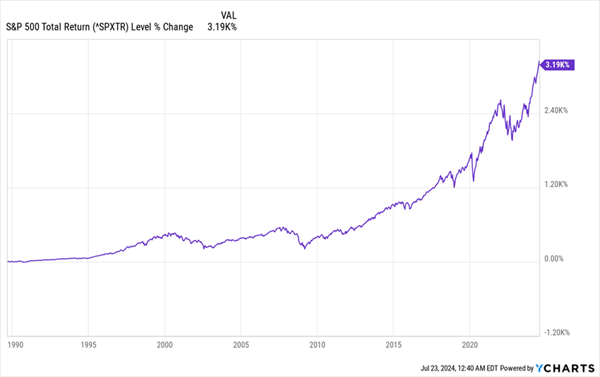
The S&P 500 has done even better in the last 35 years than it did before that period, providing a 10.5% annualized return. In other words, a $100,000 investment grew to $3,293,667 over this period with zero extra investment.
This is why wealthy people tend to lean on stocks: Over the long term, stocks produce more wealth with less hassle than any other investment. Of course, stocks do fall in the short term, which is why higher-net-worth investors diversify into corporate bonds and real estate. These assets also provide more of a cash cushion during lean years.
Real Estate Stocks Add a “Downturn Cushion”
And what about those lean years? Consider the 2000s, when stocks stayed pretty much flat for a decade. Wouldn’t it have been better to wait to buy in?
Let’s remember that the flat stock market of the 2000s is inside this 35-year period of 10.5% annualized returns. So if you had a long enough time horizon, that decade of flat performance didn’t really matter. And a diversified investor during that period would have also owned other assets, like publicly traded real estate investment trusts (REITs), for example.
REITs Soared During the “Flat” 2000s Stock Market
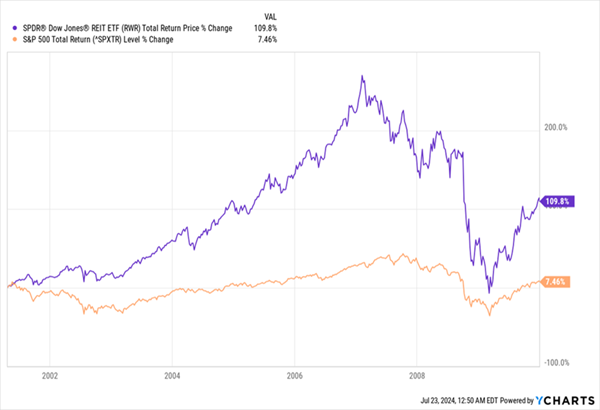
The above chart is interesting: Investors with, say, a 50% REIT allocation in their portfolios would have ridden a 7.7% annualized total return in that part of their holdings during the 2000s, going by the performance of the SPDR Dow Jones REIT ETF (RWR).
That REIT performance is pretty close to the 8.5% annualized return the S&P 500 averages in the long run and boosts the portfolio’s average return over a portfolio of stocks alone during this period (by how much depends on the allocation to stocks vs. REITs).
The strong performance of real estate won’t surprise anyone who lived through the 2000s, since real estate was hot at the time. And this was a historical anomaly that didn’t last long. Wealthy investors are aware of occasional periods like this. That’s why they use diversification to ensure a steady income stream and keep their eye on the long-term trend.
Stocks and Real Estate Meet Up, Despite Different Paths
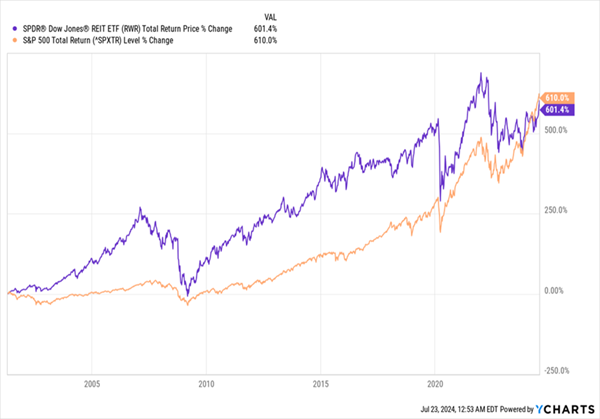
Over the 24 years since RWR launched, it’s returned an average of 8.8% annually. The S&P 500 returned 8.9%. Again, you can see how both stocks and real estate tend to settle on that 8.5% annualized return.
There are two takeaways here:
- A diversified portfolio of assets is likely to get you a high long-term return.
- In the short term, diversification gets you a collection of high-quality assets so that, on average, you’ll get closer to seeing 8.5% returns consistently every year.
Which brings me back to CEFs, which are a smart place to go for this kind of return, as well as broad diversification.
That’s because there are hundreds of CEFs, they’re carefully regulated by the SEC (the laws that govern mutual funds and ETFs are the same as those governing CEFs) and they hold high-quality assets, like shares in leading US companies such as Amazon.com (AMZN), Visa (V) and Alphabet (GOOGL).
And since CEFs have an average yield of 8.2%, you could bring together a portfolio of real estate, bond and stock CEFs that essentially “translate” the 8.5% the S&P 500 tends to return over the long term into dividends. CEFs can do this for decades.
CEFs’ “Long Game”
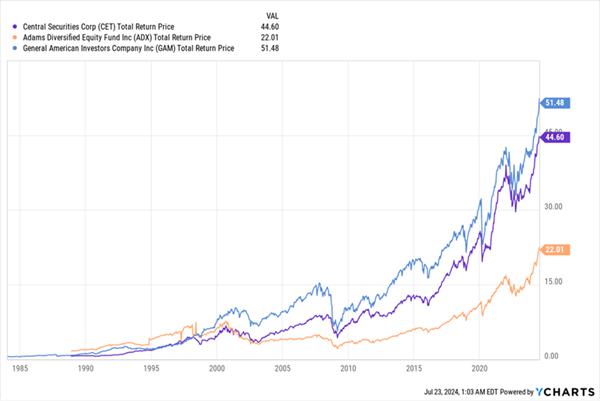
Above we see three CEFs with long track records: the Adams Diversified Equity Fund (ADX), in orange; Central Securities Corporation (CET), in purple; and General American Investors (GAM), in blue. ADX has the highest yield right now, at around 7.7%, while GAM and CET yield closer to 5%.
In the cases of GAM and CET, managers try to limit the percentage of the portfolio profits they hand out to investors every year, with an eye to giving themselves a bigger cushion to provide investors stable income in leaner years. That makes these funds attractive if you have a long time horizon and don’t need all the income now.
ADX, meantime, is ideal if you’re relying on your portfolio for income, since at its current yield you can pull in $50,000 in yearly dividends on an investment of less than $650,000. In contrast, a typical index fund would require over $3.8 million to pay the same.
With all this in mind, I have no idea why you’d go with the index fund and its much lower income stream, especially when these CEFs hold many of the same companies. The choice here, for just about all investors, is pretty clear.
These 5 CEFs “Translate” Stock Gains Into 9.2% Dividends (and Pay Monthly!)
Few people realize it, but many CEFs also pay dividends monthly, and they pay BIG dividends, too. My 5 top monthly payers kick out a 9.2% average payout now. That’s far more than the S&P 500 has returned (in price gains and dividends!) in the long term.
Which means these 5 stout monthly payers outrun stocks in dividends alone!
They’re cheap now, but that won’t last, so we need to make our move. Click here and I’ll give you more details about these 5 high-yielding monthly payers, plus the opportunity to download a free Special Report revealing their names and tickers.