The average yield among the 25 largest dividend exchange-traded funds is a meager 2.7% right now. That means if you plunked a $1 million on ETFs dedicated to dividend stocks, you’d only make $27,000 every year.
That’s barely higher than the 2018 federal poverty level for a family of four ($25,100)!
But you and I can do better – by double, even triple! I’m talking about turning these lame 2.7% payouts into fat dividends of 7.2% or more.
Serious yield hunters gravitate toward closed-end funds, where it’s common to find distributions of 7.2% or even higher! A retirement income of $72,000, after all, is a lot cushier than scraping by on $27,000 annually.
But it’s staggering just how few investors have discovered the income power of CEFs.
Consider this: The top 10 closed-end funds by assets under management command $27.4 billion in AUM … versus $1 trillion for the 10 top exchange-traded funds! The largest ETF – the SPDR S&P 500 ETF (SPY) – alone accounts for roughly $270 billion in assets, or 10x the top 10 CEFs!
Some investors are turned off by CEFs’ high expenses, but in many cases, savvy management more than compensates investors with superior total returns. But most investors simply haven’t come across closed-end funds; the media under-covers them, and their providers have smaller advertising budgets than the ETF world’s big boys.
Plus, all of the fat yields I’m going to quote you are net of fees. Investors who get scared away by these expenses are missing the point. We need the expertise these money managers are providing us, because they are minting money in these niche markets (and showering us with oversized yields as a result!)
Here are five “portfolio replacement” CEFs that at a minimum double (but offer 3x, 4x … even 6x!) the income potential of uber-popular ETFs that many investors have – including the granddaddy of them all, the SPY.
Templeton Emerging Markets (EMF)
Distribution Rate: 7.5%
Expenses: 1.37%
Replaces: Vanguard FTSE Emerging Markets ETF (VWO, 2.6% Yield)
When you think of emerging markets, you think of growth, not income. After all, the Vanguard FTSE Emerging Markets ETF (VWO) – one of the 10 largest ETFs on Wall Street – yields a paltry 2.6%.
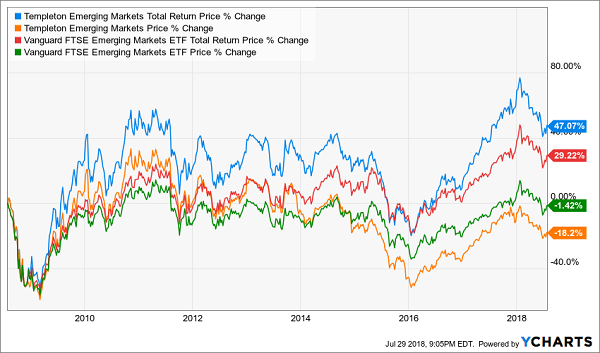
But Templeton Emerging Markets (EMF) is a way to tap countries such as China, Russia and South Korea for income, too.
Templeton’s EMF is a portfolio of roughly 90 holdings across more than a dozen emerging markets. Like most emerging-markets funds, China makes up the biggest allocation (at 23.4%) of the fund. South Korea (16%), Taiwan (10.4%) and Russia (9.6%) are other significant holdings. The companies in the portfolio should be familiar to most EM investors, too: The likes of Korean electronics giant Samsung, South African multinational internet company Naspers (NPSNY) and chip foundry Taiwan Semiconductor Manufacturing Co. (TSM).
VWO might look like the better investment at a quick glance: It has a much wider portfolio and a cheaper expense ratio. But Templeton Emerging Markets is able to squeeze a lot more blood from the developing world, resulting in slightly more volatile but ultimately better returns.
Templeton Emerging Markets: A “Total” EM Solution
Royce Value Trust (RVT)
Distribution Rate: 7.6%
Expenses: 0.54%
Replaces: iShares Russell 2000 ETF (IWM, 1.2% Yield)
Just like you don’t expect dividends from emerging markets, you probably don’t expect to squeeze much income out of small-cap stocks. The iShares Russell 2000 ETF (IWM), for instance, is synonymous with growth, and for an obvious reason – the lure of small companies is their ability to quickly double in value, taking their stocks with them. That’s because most small caps pour every cent of cash into building the business … not repaying shareholders.
You wouldn’t know it, though, to look at the distribution on the Royce Value Trust (RVT) closed-end fund, which at 7.6% is more than 6x the yield on the IWM.
Royce Value Trust isn’t investing in secret high-yielding small caps that the Russell 2000 somehow hasn’t discovered. As loyal CEF followers know, distributions aren’t the same thing as dividends – they include dividends, but also return of capital, short-term and long-term gains. In fact, the lion’s share of Royce Value Trust’s distribution every year is made up of long-term gains, which means the distribution can vary from year to year.
Still, the RVT and its roughly 370 small-cap holdings – including FLIR Systems (FLIR), Heico Corporation (HEI) and Quaker Chemical (KWR) – dole out sizable distributions most years. Better yet, this closed-end fund has the long-term performance edge over the IWM since 1986 inception, at 10.16%/9.76% annually.
BlackRock Credit Allocation (BTZ)
Distribution Rate: 6.6%
Expenses: 1.23%
Replaces: iShares iBoxx $ Investment Grade Corporate Bond ETF (LQD, Yield 3.3%)
The iShares iBoxx $ Investment Grade Corporate Bond ETF (LQD), in addition to being a mouthful, is the largest investment-grade corporate-debt ETF in the game, at $34.3 billion in assets. But as I’ve pointed out before, we can do better by targeting smart bond managers who know how to identify values that index funds’ rules exclude them from participating in.
Ironically enough, a worthy competitor to LQD comes from within.
BlackRock (BLK), which provides ETFs under the iShares moniker, also is a player in the CEF game, and offers an acceptable (albeit not perfectly faithful) replacement in the BlackRock Credit Allocation (BTZ) closed-end fund.
BTZ’s small team of portfolio managers include Jeff Cucunato, who has been head of investment-grade credit at BlackRock since 2006. And the fund primarily plays to his strength, with 51% of the fund dedicated to investment-grade corporates. Unlike LQD, however, this is a blended CEF, with another 25% in high-yield bonds, 13.8% in non-U.S. developed-market credit and small amounts in securitized products and emerging-market debt, among other allocations.
About two-thirds of the fund’s credit is investment-grade, and roughly the same amount is dedicated to debt with short- and medium-term maturities. Nonetheless, the CEF yields an ample 6.6%, in some part thanks to the use of leverage (~22% at the moment).
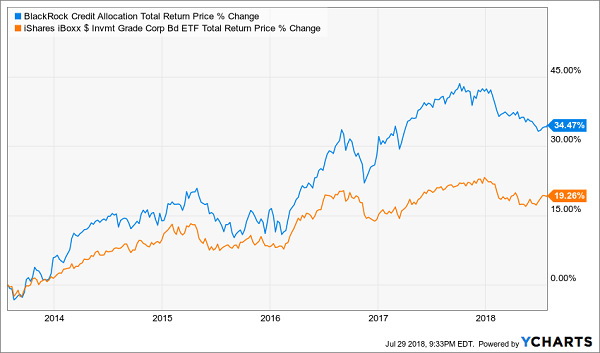
Investors do see more downside when corporates stumble, but management has kept the fund well ahead of the LQD over the past five years. It’s not a perfect 1-for-1 replacement for LQD, but it’s still a significant upgrade.
BlackRock Credit Allocation (BTZ) Wipes the Floor With Its ETF Cousin
Columbia Seligman Premium Tech Growth (STK)
Distribution Rate: 8.4%
Expenses: 1.16%
Replaces: Technology Select Sector SPDR Fund (XLK, 1.3% Yield)
The technology sector has a reputation for being chintzy, and that’s reflected in the Technology Select Sector SPDR Fund’s (XLK) laughable 1.3% yield. But make no mistake: You can find decent income in the sector – International Business Machines (IBM), Nokia (NOK) and Seagate Technology (STX) are just a few highly recognizable names that yield more than 4%.
Of course, the Columbia Seligman Premium Tech Growth (STK) closed-end fund puts all those yields to shame, delivering more than 8% in annual distributions.
The portfolio is a mix of a lot of prominent tech stocks you’ll find atop traditional index funds such as XLK, as well as a few that are much further down the totem pole. STK holds the likes of Apple (AAPL) and Broadcom (AVGO), but also semiconductor equipment company Lam Research (LRCX) and electronic design automation firm Synopsys (SNPS).
But Columbia’s tech fund has actually lagged tech funds such as the XLK and Vanguard Information Technology ETF (VGT) and provides an example of how CEFs can backfire in the wrong situation. Per CEF expert Michael Foster:
“A big reason for STK’s lower return is the bigger dividend—in order to sustain that big income stream for investors, STK had to take more money out of the tech market to keep payments to shareholders. Inevitably, the profit-taking to sustain dividends resulted in lower profits over the long term, resulting in STK’s underperformance.”
Lesson learned: Not EVERY closed-end fund is a winner. Selection is key.
Adams Diversified Equity Fund (ADX)
Distribution Rate: 6%*
Expenses: 0.56%
Replaces: SPDR S&P 500 ETF (SPY, 1.8% Yield)
The SPDR S&P 500 ETF celebrated its 25th birthday this year at the top of the mountain – it’s the largest exchange-traded fund by assets under management, and it’s not even close.
But it’s a toddler compared to the Adams Diversified Equity Fund (ADX).
Adams Diversified Equity has been producing returns for investors since 1929 – which means it has survived 13 American recessions and the Great Depression. Despite its longevity, it’s a relative minnow compared to the SPY at just $1.8 billion in assets under management. Still, it’s worth a closer look.
The ADX, like SPY, is a blended U.S. large-cap fund, with its stocks sporting an average weighted market cap of about $125 billion (read: they’re blue chips). And like the SPY, ADX is heavy in information technology stocks (25.8%), especially at the top. Apple, Amazon.com (AMZN), Microsoft (MSFT), Alphabet (GOOGL) and Facebook (FB) are top-five holdings of each fund. In fact, each of ADX’s sector weightings are within about a percentage point of SPDR’s S&P 500 ETF. Perhaps the biggest difference is in breadth; Adams has a more concentrated portfolio of just 86 holdings.
And while a screener might tell you that ADX yields less than 2%, that’s not quite the case. The CEF is committed to a minimum 6% distribution rate; the lion’s share of it tends to come at the end of the year, powered mostly by capital gains.
Adams Diversified Equity (ADX) Can Go Toe-to-Toe With the Best
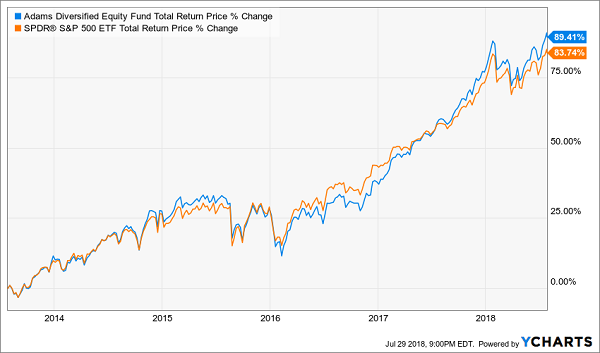
When you factor in that hefty distribution, Adams Diversified Equity at least looks like a worthy competitor to the world’s largest fund.
But you and I can do even better.
3 CEFs That Will Bankroll Your Entire Retirement
If you want market-beating performance, avoid ETFs outright. Top-flight CEFs are the only funds I own in my 8% “no withdrawal” retirement strategy, which allows retirees to rely entirely on dividend income and leave their principal 100% intact.
Well that’s not exactly right.
Their principal is more than 100% intact thanks to price gains like these! Which means principal is actually 110% intact after year 1, and so on.
To do this, I seek out closed-end funds that:
- Pay 8% or better…
- Have well-funded distributions…
- Trade at meaningful discounts to their NAV…
- And know how to make their shareholders money.
I talk to management, too, because online research isn’t enough. I also track insider buying to make sure these guys have real skin in the game.
Today, three “blue-chip” CEFs rank as my top income buys. And wait until you these their yields! These “slam dunk” income plays pay 8.2%, 9.9% and even 10.1% dividends.
Plus, they trade at 10% to 15% discounts to their net asset value (NAV) today. Which means they’re perfect for your retirement portfolio because your downside risk is minimal. Even if the market takes a tumble, these top-notch funds will simply trade flat… and we’ll still collect those fat dividends!
If you’re an investor who strives to live off dividends alone, while slowly but safely increasing the value of your nest egg, these are the ideal holdings for you. Click here and I’ll explain more about my no-withdrawal approach – plus I’ll share the names, tickers and buy prices of my 3 favorite closed-end funds for 8.2%, 9.9% and 10.1% yields.