Well, that didn’t last long.
A few months ago, all we heard from the mainstream media is that the “sell America” trend was going to stick around for a long time.
Nowadays, we’re still hearing that. But one corner of the market—closed-end funds (CEFs)—is telling us something interesting: That investors are starting to turn their attention back to the US.
That’s given us an opportunity to front-run this quiet shift now, while it’s still early, with some high-yield CEFs trading at attractive discounts. In a second, I’ll walk you through the signal we’re getting from two of the biggest US-focused CEFs—one holding stocks, the other corporate bonds.
First, though, let’s talk about what the real data says about one of the biggest fears that’s been driving the so-called “sell America” theme—US debt.
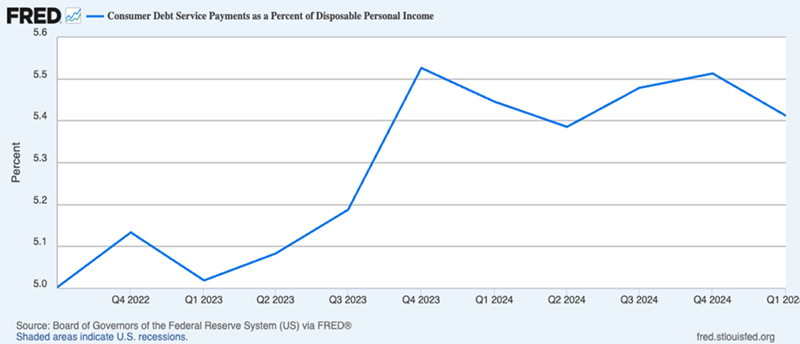
This chart shows how much US households pay to manage their debt, as a percentage of disposable income. It’s the main evidence supporting the argument that fears about US economic stability are warranted.
To be fair, this chart does show a jump—about 10% in the last three years. In other words, yes, Americans’ debt costs are higher than they were in 2022. That’s a sure sign the US consumer is tapped out, right?
If this all sounds familiar, it’s because it’s the same story the press pushed in 2022, with headlines like “Consumer Debt Surges at Fastest Pace in 15 Years.” Three years later, the US economy remains strong. So maybe it’s going to finally falter now?
That’s what the Wall Street Journal has been saying. In March, it published a story titled, “Consumers Keep Bailing Out the Economy. Now They Might Be Maxed Out,” and another headlined: “Recession Fears Stoke Concerns Americans Are Overstretched.”
Now let’s look at a chart that starts to dispel this fear and tell us the real story here.
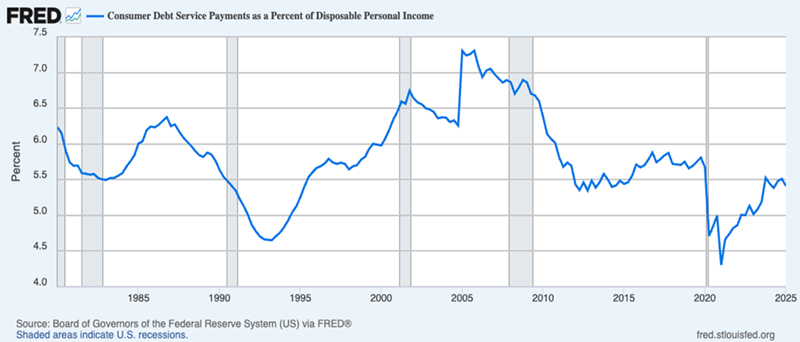
Household debt payments definitely rose from their all-time low in 2021. Now they’ve leveled off at around 5.5% of disposable income. That’s about where they were in the early 2010s. Today’s level is also far below the average in the 1980s, 1990s and 2000s.
In other words, Americans are not maxed out. In fact, their household-debt levels are quite low. According to IMF data, US households are less indebted than those in much of Europe and Asia, as well as Australia and Canada, both of which are places thought to be fiscally responsible.

At current levels of American disposable income (which is among the highest in the world) and debt levels (one of the lowest), the average US household is paying about $282 per month on its debt. That’s hardly a lot of money for most people!
It’s also worth pointing out that the average American family’s net worth had risen to $192,700 by 2022 (when the Federal Reserve did its latest survey), fully recovering from the Great Recession:
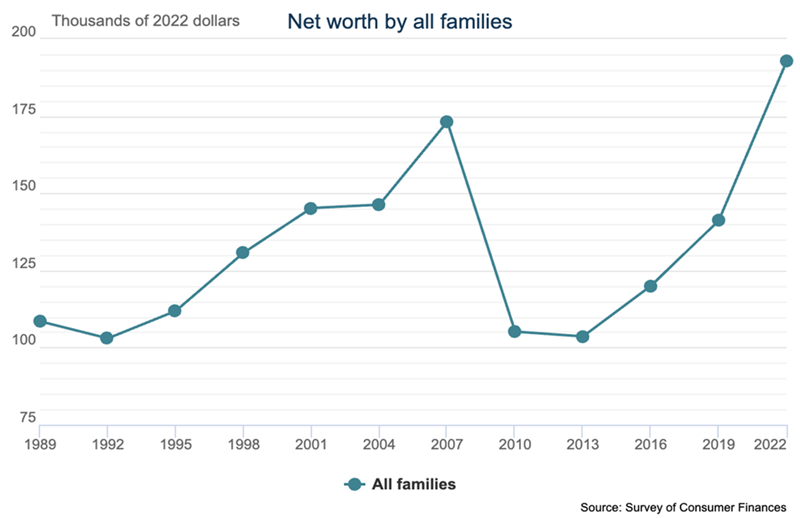
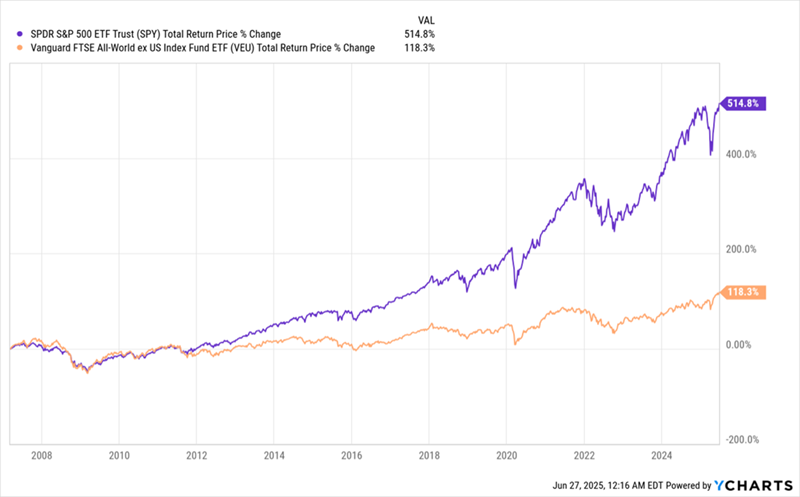
There’s a direct line between this financial improvement and the S&P 500’s world-beating long-term performance:
US Stocks Take On All Comers—and Win
Which brings me back to that indication CEFs are giving us that investors may finally be catching on to the strength of the US consumer.
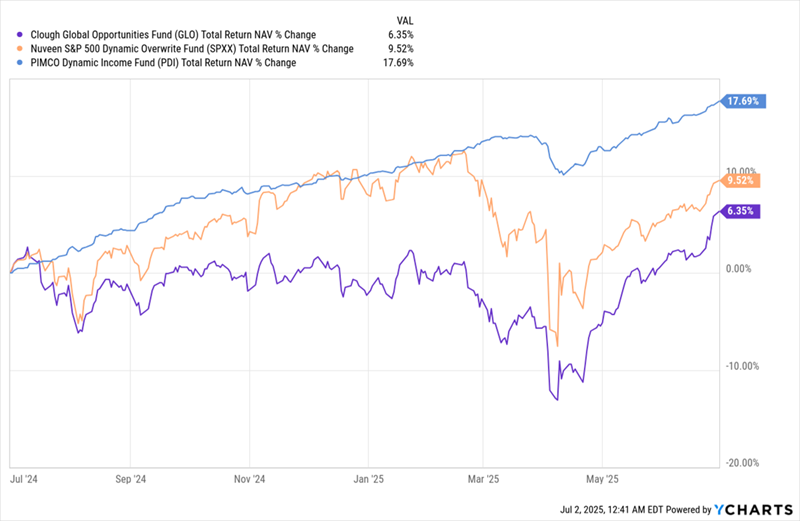
To get at that, let’s look at a major corporate-bond CEF, the PIMCO Dynamic Income Fund (PDI), and the Nuveen S&P 500 Dynamic Overwrite Fund (SPXX). As SPXX’s name says, it holds the S&P 500, but it also sells call options—a low-risk way to support its dividend.
In a June 9 article on our Contrarian Outlook website, we talked about how SPXX and PDI work together to give an investor a nicely diversified “mini-portfolio” of stocks and bonds. We also identified an international fund, the Clough Global Opportunities Fund (GLO), as a less-effective way to diversify.
With CEFs, we have two measures of performance: total return based on net asset value (NAV, or the value of a fund’s underlying portfolio) and total return based on market price.
These can be different, with NAV a better measure of the fund’s portfolio management and market price a measure of the fund’s overall performance, subject to investor whim. When we look at the total NAV returns of the US-focused funds in the past year (SPXX, in orange below, and PDI, in blue), we see that they exceed that of the more global fund, GLO (in purple), by a fair margin:
US Stock, Bond Funds’ Portfolios Top Their Global Rival …
But if we pivot away from NAV for a moment and look at GLO’s total price return, we see that the global fund, GLO, has a far better performance, returning 15% (in orange below), far higher than the 6.4% return on its NAV (in purple) and indeed ahead of SPXX.
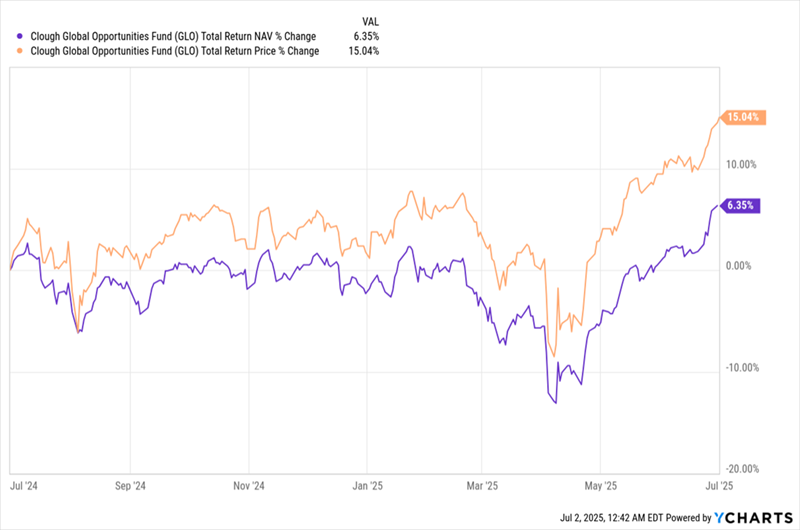
Here’s what’s really happening: Market demand for this fund is outpacing the fundamentals by a lot. That’s causing GLO’s discount to NAV to narrow (it’s now 11.7%).
Over time, investors will likely realize that fundamentals are underperforming market demand here and that, when compared to SPXX’s 7.6% yield and PDI’s 14% payout, both funds are better contenders than GLO to deliver strong total returns alongside a rotation back into America.
And that means there’s still time to profit from these two funds and avoid the growing possibility of underperforming by holding GLO, as that fund’s market-price gains run ahead of its fundamentals, potentially setting it up for a fall.
In short, the “pivot back to America” trade is wide open in CEF-land, where big (and often monthly paid) dividends are also on the table—if you stick to the data and ignore media fearmongering.
5 Huge (10.2%)—and Monthly—Dividends the “Sell America” Crowd Missed
SPXX and PDI are both well-known, smartly run CEFs. You may actually hold one or both now.
If you do, great! You’re already enjoying strong payouts and are nicely positioned for gains as “sell America” fizzles. But they’re not the funds I see gaining the most as the investment tides shift back to American shores.
For those, look to the 5 funds in my “Monthly Dividend CEF Portfolio.” These 5 funds are all smaller CEFs, so they’re a little further off the map. That means they sport even bigger discounts—and with those, even bigger upside.
Moreover, you don’t have to sacrifice steady income to get these gains: These 5 stout funds hand you a 10.2% average dividend—yes, paid monthly!
The time to buy them is now. Click here and I’ll walk you through all 5 of these “battleship” monthly dividend payers and give you a free Special Report revealing their names and tickers.