In three charts, we’ll show why monthly dividends are superior to even blue-chip payers. Plus, we’ll discuss five monthlies that yield between 9.7% and 13.5%.
First, let’s talk about monthly dividend timing. Check out what our monthly cash flow looks like if we invest in five of the market’s largest dividend-paying companies. These are five of the S&P 500’s biggest holdings, and we can find them in just about every major large-cap fund:
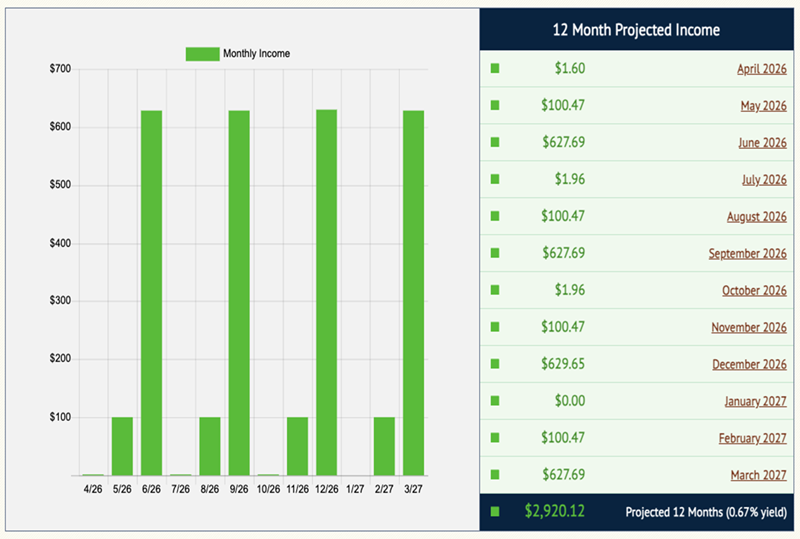
Source: Income Calendar
The good news? Every three months, we cash a dividend check.
The bad news? That harvest is followed by two months of crickets.
Let’s compare that dividend calendar with the projections for my five-pack of monthly payers.
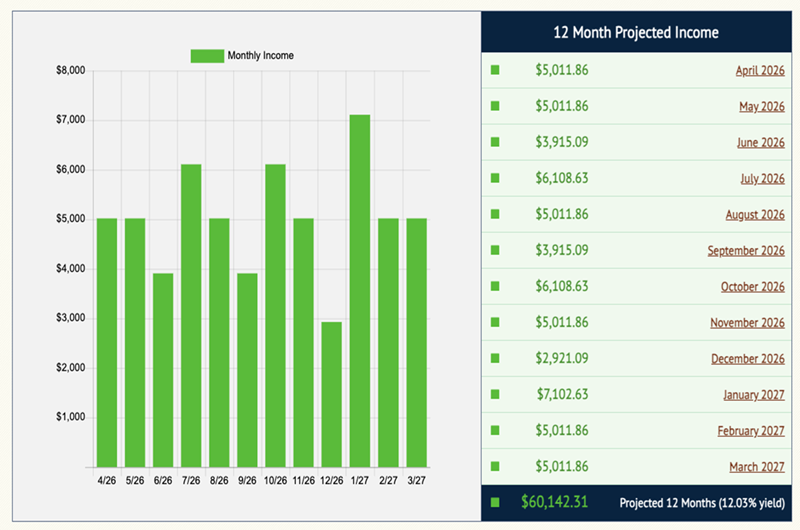
Source: Income Calendar
We can retire on dividends with this type of schedule.
Look at the bottom-right figures, too. Check out that yield gap. It’s not subtle.
It’s not unusual, either. If you’re holding investments that pay monthly, chances are they yield many times more than the broader market. In fact, my final graphic shows not only that’s true, but that my five-pack of monthly payers even offers well more than double the yield of the more respectable S&P 500 High Dividend Index.
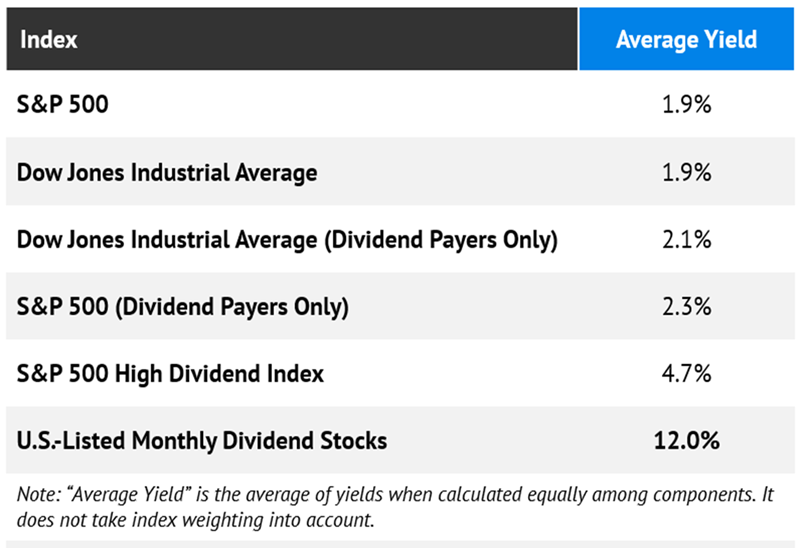
Source: S&P Global Market Intelligence
Why the fat yields? Monthly payers tend to cluster in the high-yield corners of the market that many investors never bother to explore, like real estate investment trusts (REITs), business development companies (BDCs), and closed-end funds (CEFs).
Here’s the beauty of it: REITs, BDCs and CEFs cover enough ground that we can build a genuinely diversified monthly-income portfolio without ever leaving their ZIP codes. Just consider this five-pack of 9.7% to 13.5% yielders that pay us every 30 days or so.
Gladstone Commercial (GOOD)
Dividend Yield: 9.7%
I’ll start with a traditional equity REIT, Gladstone Commercial (GOOD). This landlord owns 151 single-tenant and anchored multi-tenant net-leased properties, leased out to 109 unique tenants, typically in long-term contracts of seven years or longer.
Occupancy is high, at 99.1% as of the end of 2025, but that’s carried by its industrial tenants, which boast a sparkling 99.8% occupancy. The office portfolio is around 94%—not great, but up a couple points from spring 2025.
It’s also a lesser worry by the year. Several mixed-property REITs have been selling off their office property ever since COVID blasted that part of the real estate market, but Gladstone’s slow migration away predates the pandemic.
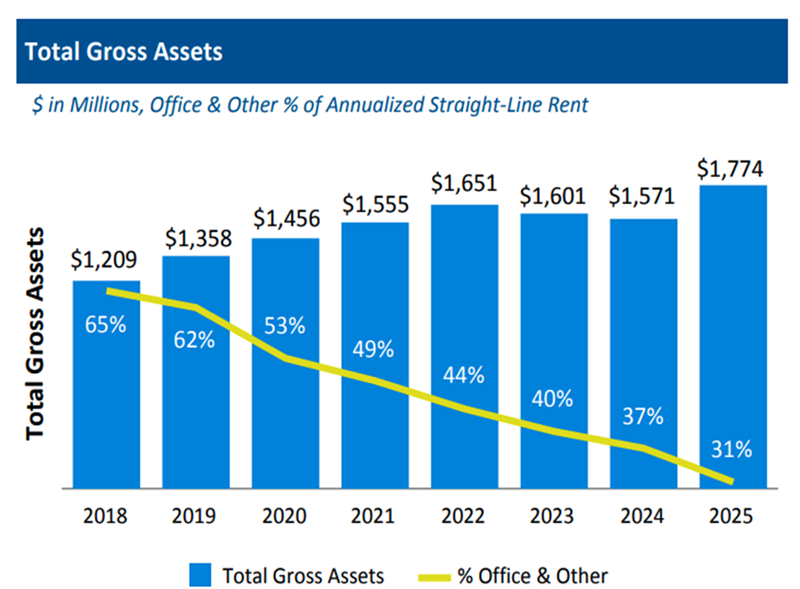
Source: Gladstone Commercial March 2026 Investor Presentation
The biggest headline out of Gladstone lately is founder David Gladstone’s exit from the CEO chair. In fact, he’s handing over the reins not just at GOOD, but also at two BDCs he founded—Gladstone Capital (GLAD) and Gladstone Investment (GAIN). In reality, it’s a nothingburger for now. At GOOD, David will be succeeded by Arthur Cooper, who has been with the Gladstone family of companies since 2001 and Gladstone Commercial’s president since 2022. Meanwhile, David will still be chairman, CEO and president of Gladstone Management Corporation, GOOD’s external manager.
Shares have soared so far in 2026, but it might just be a bounce off a bottom—GOOD is still 30% below late 2024 levels. So the company needs some shaking up, but there are no immediate catalysts on the horizon. Gladstone didn’t make a single acquisition during its fourth quarter. But GOOD has done a decent job of repositioning its balance sheet, including making an $85 million private placement debt issuance in December. That could give it some room for dealmaking in the year ahead.
GOOD is now three years removed from a 20% cut to its monthly dividend, to the current 10 cents per share. But the company still pays a sweet yield of nearly 10%, and that dividend is at least covered for now, at a little less than 90% of core funds from operations (FFO, an important REIT metric of profitability and dividend health). But there’s not much fuel remaining for dividend growth, either.
Trinity Capital (TRIN)
Dividend Yield: 13.1%
GOOD’s nearly double-digit yield is a relative rarity among equity REITs. But life-changing yields are the norm for BDCs like Trinity Capital (TRIN).
Trinity is among the more growth-focused BDCs out there. Its bleeding-edge portfolio includes companies such as quantum computing leader Rigetti Computing (RGTI), emergent hair color startup Madison Reed and automotive industry AI operating system maker Impel.
And as you can see, Trinity’s breadth extends past its portfolio and into its financing verticals:
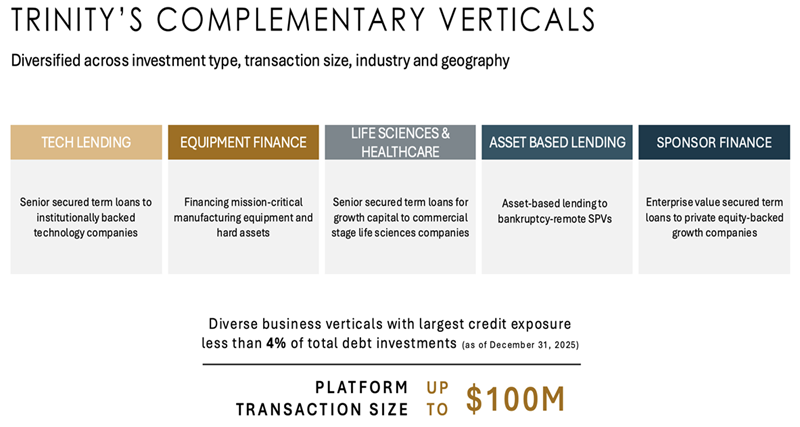
Source: Trinity Capital Q4 2025 Investor Presentation
Yes, debt financing is still Trinity’s bread ‘n’ butter, at 77% of the portfolio at fair value. But that’s still less than many other BDCs. Floating-rate debt makes up a majority of those investments, at 83% currently—that’s a sizable (and slowly growing) portion, but again, still less than many other debt BDCs. The relatively heavier mix of fixed-rate loans bodes better for TRIN than its peers if the Federal Reserve does resume easing this year.
The remaining space is taken up by equipment financing (14%) and equity/warrants (9%).
There’s a lot to like here. Non-accruals fell below 1% of the portfolio during the most recent quarter, and the company’s preliminary Q1 financials showed it’s putting more capital to work. The monthly dividend is a recent development, too—the company switched from a quarterly schedule at the start of 2026.
TRIN’s valuation could stand to cool off, though. It currently trades for a sky-high 15% premium to its net asset value.
AGNC Investment (AGNC)
Dividend Yield: 13.5%
AGNC Investment (AGNC) is a mortgage real estate investment trust, or mREIT. So rather than dealing in properties, it deals in real estate “paper.” Specifically, AGNC purchases mortgage-backed securities (MBSs), often through repurchase agreements, then profits off the spread between its loan cost and the income its assets throw off.
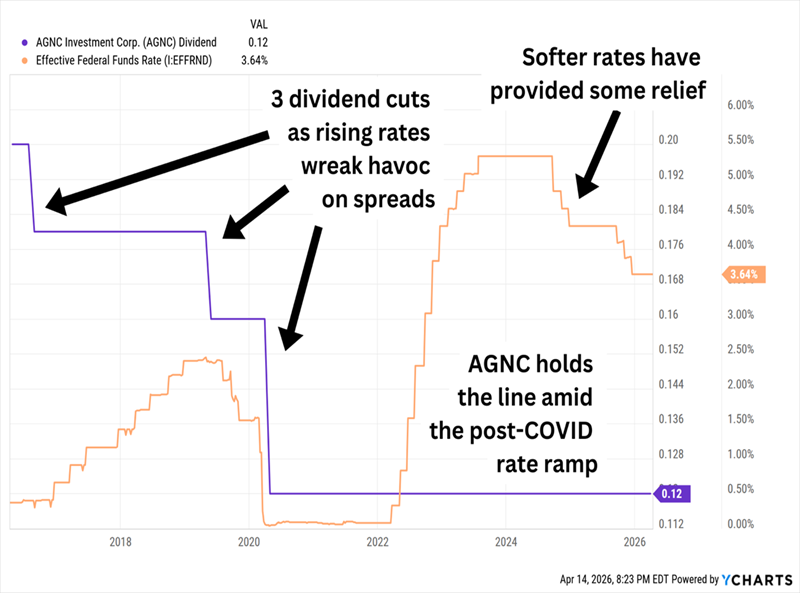
Generally speaking, Federal Reserve cuts are a good thing for mREITs. Falling short-term rates would cut AGNC’s repo costs almost immediately. The reverse, of course, is true, as I pointed out last year:
As you can see below, management cut the payout (in purple) when the Fed hiked rates (in orange) through to the end of 2019 and into the COVID lockdown period. We’d expect that, as rising rates boosted repo costs and COVID uncertainty—especially in the early days—put the real estate market on ice. But look to the right and you’ll see that AGNC did hold the line on the dividend as the Fed drove rates higher in response to the inflation surge of 2022/2023. That’s a great sign—and shows the payout likely got an assist from the hedging programs AGNC uses to cut its rate risk:
AGNC’s Checkered Dividend Past Has Some Saving Grace
Can the dividend stay the course? Management was optimistic about its coverage during the most recent quarterly call. The math bears it out, too—though a projected $1.44 in dividends on earnings estimates of $1.56 (92%) doesn’t exactly leave much room for growth, or error.
But AGNC will need help from the Fed to deliver any more return than what the yield provides. Spreads have tightened significantly, and shares are trading at roughly 1.2 times book value.
Tortoise Energy Infrastructure (TYG)
Distribution Rate: 11.8%
Another high-yield acronym—master limited partnerships (MLPs)—virtually always stick to a quarterly distribution schedule. But thanks to closed-end funds, we can get energy MLPs to pay us each and every month.
Of course, like most “energy infrastructure” funds, Tortoise Energy Infrastructure (TYG) isn’t a pure-play MLP fund. It’s a roughly 55/45 blend of energy- and utility-sector stocks, for one. Also, while its energy “sleeve” does hold MLPs like MPLX LP (MPLX) and Energy Transfer LP (ET), it also owns midstream corporations such as Williams Companies (WMB) and ONEOK (OKE).
TYG really does behave like a hybrid, too—some days it trades like a utility, other days it moves with crude oil.
You Get the Best (But Sometimes the Worst) of Both Worlds
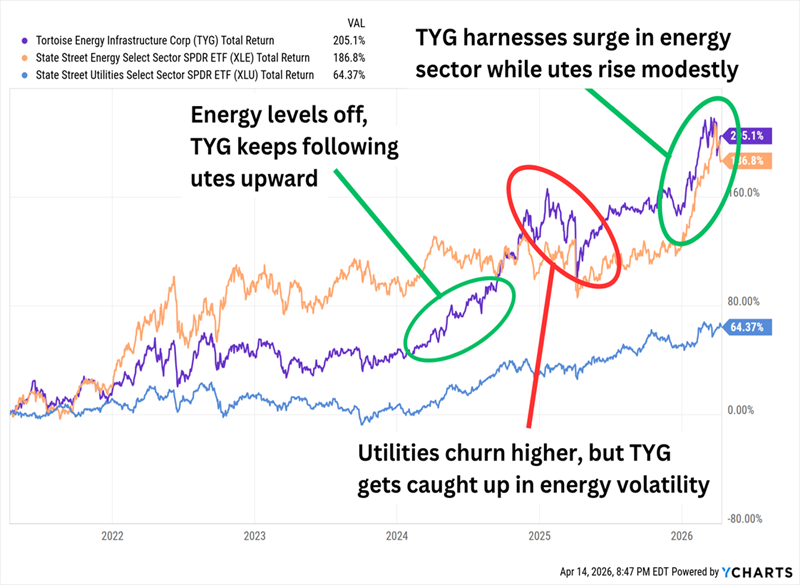
Tortoise Energy Infrastructure also uses a moderate amount of leverage (roughly 20%), but the blend of energy and utilities prevents TYG from some of the more exaggerated moves that single-strategy CEFs show against their plain-vanilla indexed competitors. The leverage also helps make the sectors’ already good yields great—this monthly payout is almost 12% at current levels.
As we’d expect, 2026’s rally has fattened up TYG’s valuation. The bigger problem is that it’s been getting plumper for years.
Once on Sale at a 20%+ Discount to NAV, TYG Is Now Fairly Valued
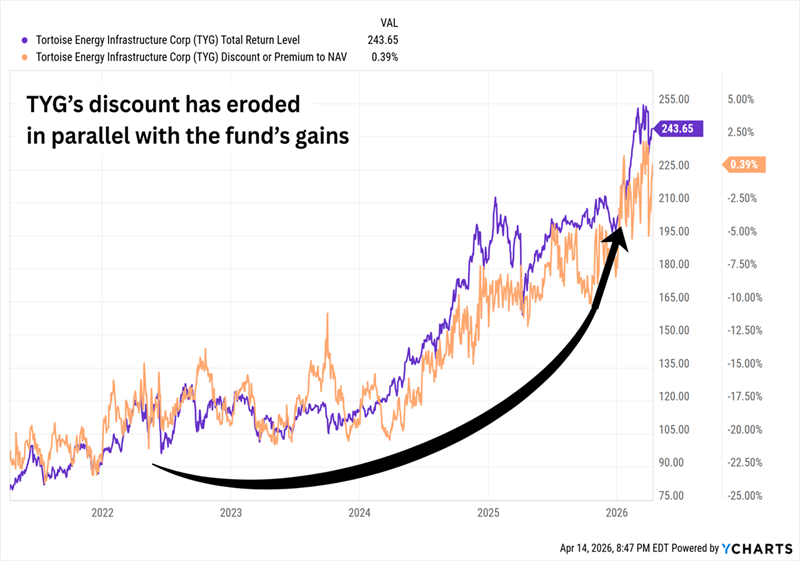
That doesn’t necessarily spell doom for TYG. But it easily could make future gains much harder to come by, at least in the short term.
abrdn Total Dynamic Dividend Fund (AOD)
Distribution Rate: 12.1%
We can even get monthly dividends from a worldwide portfolio of well-known blue chips.
abrdn Total Dynamic Dividend Fund (AOD) looks almost identical to what you’d expect out of a bog-standard global mutual fund. It’s a decent-sized portfolio of more than 80 predominantly large-cap stocks—growth names like Taiwan Semiconductor (TSM) and Alphabet (GOOGL), but also generous yielders such as French integrated energy giant TotalEnergies (TTE) and Dutch multinational bank ING Group (ING).
Management is happy to hold a percentage point or two in preferred stocks, and it will also use forward currency contracts to hedge foreign exchange risk. But there’s extremely little debt leverage (less than 1%) and no covered call trading.
Over the very long term, AOD hasn’t quite passed muster, but management has been far more competitive during the past 10 years or so, outperforming the category’s largest index ETF over that time.
With a Little More Volatility—But Not Much
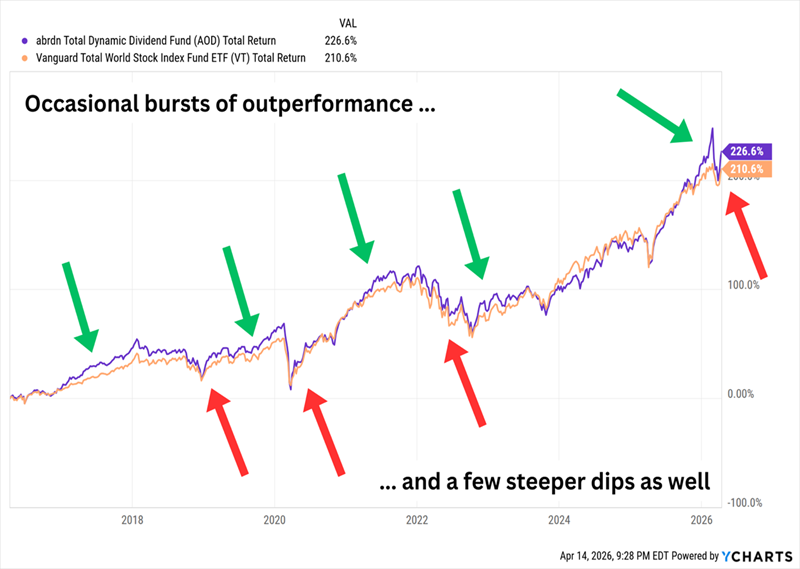
What makes funds like AOD worth a second look to income investors like us is how we get the returns. The lion’s share of those gains is from distributions, not price gains, which perpetually lag peers.
The makeup of those distributions varies—in 2025, 66% of the year’s distributions came from return of capital or short-term capital gains. The year before, less than 30% came from RoC, and the rest was true dividend income.
Whatever they’re made of, they’re always made on a monthly basis.
How to Lock in Safe, Steady Monthly Dividends of Up to 14.9%
If your experience is anything like mine, you’ve been watching your monthly bills climb higher and higher for years—and fast.
Inflation is eating away at Americans’ financial security, which is why people closing in on their nest-egg targets for retirement are suddenly starting to get the jitters.
$1 million to comfortably retire? Yeah, maybe before COVID.
But here’s the thing: You very well may be able to clock out on a realistic amount of money—much less than a million, in fact.
But you can’t do it holding Dow Jones blue chips.
You need true dividend powerhouses—like the companies I prioritize in my “9% Monthly Payer Portfolio.”
It’s all in the name. These generous stocks and funds average a yield of more than 9% across the board, and some of them pay up to almost 15% a year. That’s enough to live on dividends alone without ever needing to break off a piece of your nest egg to generate cash.
So, retirement on less than a million dollars? Yes. Here’s the math:
- A $600,000 nest egg could earn $54,000—in many places in the U.S., that’s enough for a fully paid retirement without even factoring in Social Security!
- And let’s say you have managed to stash away a cool million bucks? The 9% Monthly Payer Portfolio would pay you a downright lush $90,000 in dividend income every year.
And you’re not cashing these dividend checks annually. Not quarterly, either.
You’re cashing them every single month.
No dumping money into certain stocks because you’re getting underpaid every third month—just paydays as smooth as when you were collecting a paycheck!
These monthly payers won’t stay this cheap for long. Click here for all the details, and turn your portfolio into a monthly dividend machine!