Closed-end funds (CEFs) yield around 8% today—and that’s on average. Plenty yield more—and deliver their payouts safely, predictably and often monthly, too.
Members of my CEF Insider service know this. As I write this, our portfolio yields a high 8.8% on average, even as many of our funds’ prices have risen with this year’s strong market. And 12 of our current 21 holdings pay us every month.
All that said, we also know the old adage that something that seems too good to be true usually is. That also applies to CEF yields, especially when we spot a vastly overinflated one (24.6%, say).
Don’t Fall for the Siren Song of This Huge Payout
That 24.6% figure is the current forward yield on a CEF called Oxford Lane Capital Corporation (OXLC).
The allure of such a yield is powerful: Buy now, hold for a year and you get nearly a quarter of your investment back in dividends alone. Hang in for a bit more than four years and you’ve recouped it all. Anything from there on is a bonus.
Unfortunately, that’s not the case here because what the payout gives, the share price and OXLC’s falling dividend take away. That’s a common problem with twenty-something yields like this one.
Falling Stock, Falling Dividend
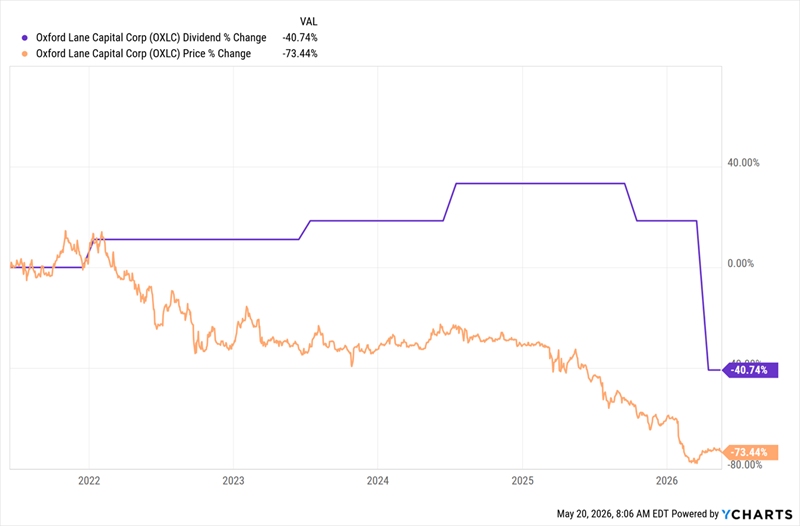
As you can see above, in the last five years, OXLC’s dividend (shown in purple) has dropped nearly 41%, while its share price has fallen even harder—a bit more than 73%. So we see that at least some of that 24.6% yield comes from the fact that the price has fallen faster than the payout.
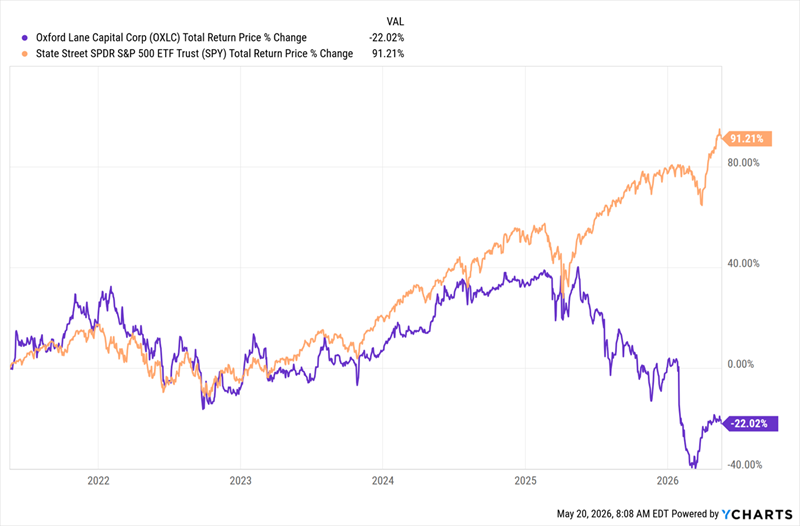
What’s more, even if an investor collected their last five years’ worth of payouts and reinvested them, they’d still be down 22% in that time (see the purple line below)—a span when the S&P 500’s total return (in orange) nearly doubled.
A 24.6% Yield Can’t Keep OXLC Out of the Red
It just goes to show how important it is to not be lured in by an oversized yield. Doing so can cause you to overlook other problems with an income play like OXLC.
But what’s the story behind this poor performance?
When I last covered OXLC, way back in June 2020, it mainly invested in collateralized loan obligations (CLOs), a kind of derivative similar to the mortgage-backed securities that were behind the 2008 financial crisis. That’s still the case today.
While these assets can do well in good times, they still entail significant risk. Even so, there is a use-case for them as a kind of asset that spreads risk for lenders. In that way, they’re useful for banks, insurance firms and others to incorporate into a mix of assets.
But for the everyday investor, there isn’t a compelling reason to invest in them, especially when there are plenty of other, safer income plays out there.
Next, let’s look at the fund’s NAV, or underlying portfolio, over the last 15 years:
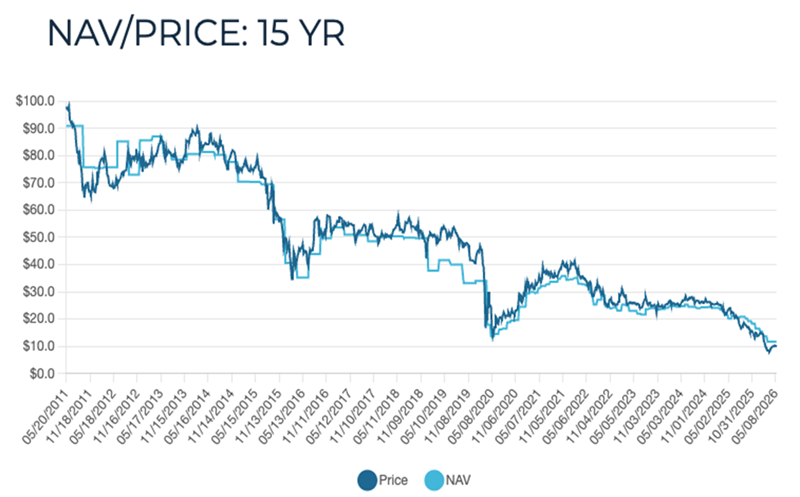
Source: CEF Data
While high yields can make up for the decline in prices you see in this chart, the decline in NAV, which has gone from nearly $100 in the early 2010s to just above $10 now, means that OXLC struggles year after year to maintain the payouts it’s already been providing.
Then there are the fees.
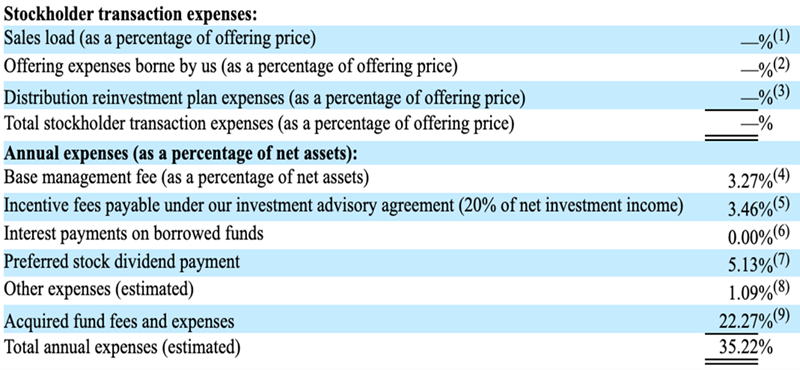
Source: United States Securities and Exchange Commission
This is a disclosure of fees OXLC incurs. The “acquired fund fees and expenses” are the costs paid inside the CLOs in which the fund invests.
The collateral manager charges fees in addition to any administrative, legal and trustee fees the CLO must pay. Then you’ve got the financing costs to fund the CLO, as well as the fees inside the individual loans. These aren’t fees OXLC pays directly, but they do come out of the CLOs, and by extension weigh on OXLC’s NAV.
On top of these pass-through costs, OXLC also bears direct expenses, including management fees, incentive fees and interest costs.
Taken together, these fees are a big part of the reason why the fund has underperformed over its lifetime. They’re a major downside of investing in CLOs—and by extension OXLC.
These 5 Monthly Payers Offer a Safe 9.3% Dividend (and They’re Cheap)
OXLC is the poster child for a dangerous dividend. Fortunately, the CEF field gives us plenty of safer options that still crush the meager payouts most regular stocks offer.
Case in point: My top 5 monthly dividend CEFs. In addition to paying us every 30 (or 31) days, they throw off a rich 9.3% average dividend between them.
Plus they trade at unusual (and undeserved) discounts, putting strong upside on the table.
I’ve put all 5 of these reliable monthly payers together in a “mini-portfolio” all their own. Now is the time to buy them, so you can start your monthly income stream as soon as possible.
Click here and I’ll tell you more about these 5 stout 9.3% monthly income plays. I’ll also give you a free report revealing their names, tickers and my full analysis of each one.