Closed-end funds (CEFs) are the last bargains left on the board. CEFs are often confused with mutual funds and ETFs, but they are different because they often trade at discounts to their net asset values (NAVs).
For contrarians like us looking for deals, this is key.
CEF trading is relatively thin. This created inefficiencies, such as select CEFs trading for as cheap as 95 or even 90 cents on the dollar.
Plus, some of them dish big dividends—like these five.
Eaton Vance Tax-Advantaged Dividend Income Fund (EVT)
Distribution Rate: 8.1%
Let’s start with the Eaton Vance Tax-Advantaged Dividend Income Fund (EVT)—a CEF that buys not just common stocks, but also preferred stocks, that distribute qualified dividends. Qualified dividends are taxed at the more favorable long-term capital gains tax rates; non-qualified dividends, like those paid by most real estate investment trusts (REITs), face less favorable short-term capital gains rates.
EVT’s four managers currently hold an 80/20 blend of common and preferred stocks, with the traditional equity “sleeve” made up of about 80 predominantly large-cap stocks. Names like JPMorgan Chase (JPM), Abbott Laboratories (ABT) and NextEra Energy (NEE) would be right at home in a bog-standard dividend fund.
But while that fund would likely pay 2% or so, EVT delivers 4x that number, at 8% currently. (And it’s a monthly dividend payer, no less.)
Part of that high yield we can chalk up to leverage—management borrows additional funds to invest even more money in their picks, which amplifies yields and gains if we’re fortunate, and amplifies losses if we’re not. Leverage currently sits at about 20% of assets.
But the other part of it is the nature of those distributions. When Eaton Vance’s fund sends out a monthly distribution, dividend income is only a (small) portion of that. The rest is capital gains, usually of the long-term variety. It’s a “managed” distribution, too—the typical dividend fund’s income will vary from one period to the next, but EVT’s monthly payout hasn’t changed since April 2024, when the CEF raised its distribution by about 11%.
The strategy doesn’t give us much of an edge over basic dividend funds, however—at least not longer-term.
EVT’s Leveraged Nature Is Good for Quicker Bouts of Outperformance
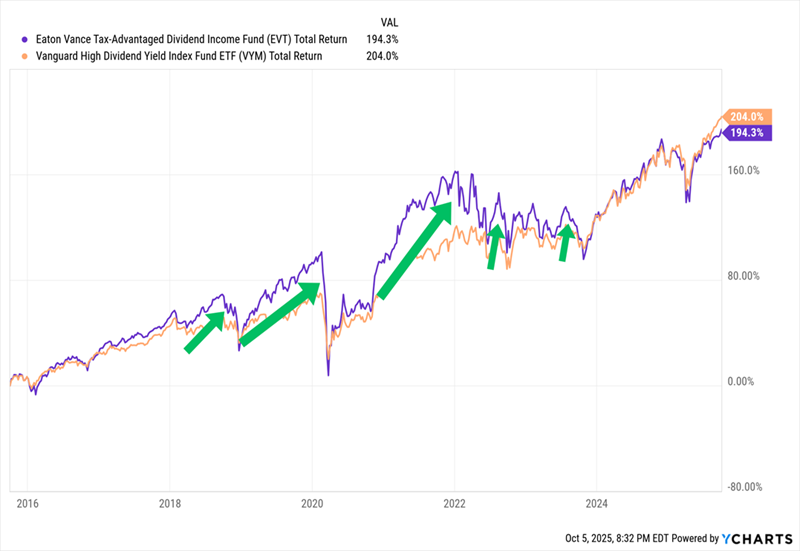
Right now, valuation is on EVT’s side, as the fund trades at a roughly 8% discount to NAV that’s wider than its longer-term 5% average.
Eaton Vance Tax-Managed Buy-Write Opportunities (ETV)
Dividend Yield: 8.3%
Options strategies are popular in CEFLand. Sometimes they’re complementary to the primary strategy, but sometimes they’re the whole point.
The latter is the case with the Eaton Vance Tax-Managed Buy-Write Opportunities (ETV). It holds a portfolio of 150, mostly large-cap stocks like Nvidia (NVDA), Microsoft (MSFT) and Apple (AAPL), then sells covered calls on a few major market indexes like the S&P 500 and Nasdaq Composite to generate income, which it distributes to its shareholders monthly.
Funds that sell covered calls—especially those where the strategy revolves around it—are designed to limit downside and provide income.
Covered Calls Cap Our Upside—But Limit Our Downside Too
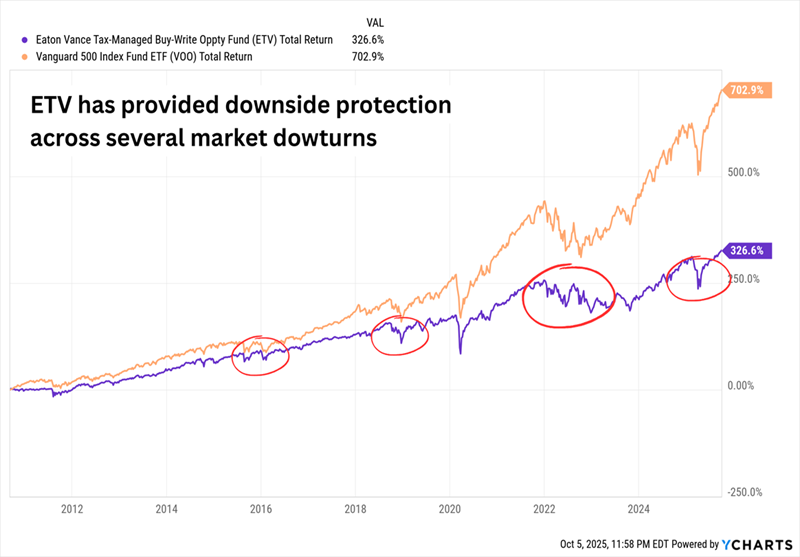
On that front, actively managed covered-call strategies like ETV are better than comparable plain-vanilla index ETFs.
Better still? We can sometimes buy that protection on the cheap; while ETV tends to trade on par with its NAV, we can buy the fund and its monthly distributions at 94 cents on the dollar.
BlackRock Enhanced Global Dividend Trust (BOE)
Distribution Rate: 8.4%
BlackRock Enhanced Global Dividend Trust (BOE) is like a mix of ETV and EVT, with global exposure (read: U.S. and international stocks) mixed in.
Management has built a roughly 50-stock portfolio that’s currently split 65/35 across U.S. and international stocks, but that blend can and will change over time. When I’ve looked at this fund in past years, I’ve seen it hold as much as half of assets in international stocks, which is higher than the typical global fund.
But like ETV and EVT, everything revolves around blue chips. It holds U.S. mega-caps like Microsoft and Broadcom (AVGO), but also developed-market names like AstraZeneca (AZN) and even emerging-market giants like Taiwan Semiconductor (TSM) and Alibaba (BABA).
International stocks might pay more than domestics, but BOE still yields roughly 3x more than most global ETFs. It’s not leverage, which is vanishingly thin, but a covered call strategy—one that helps fund a monthly distribution north of 8%.
We’re not expecting to outperform a basic index over time, but we do expect less volatility and smaller drawdowns.
On That Front, BOE Is OK, But Hardly Great
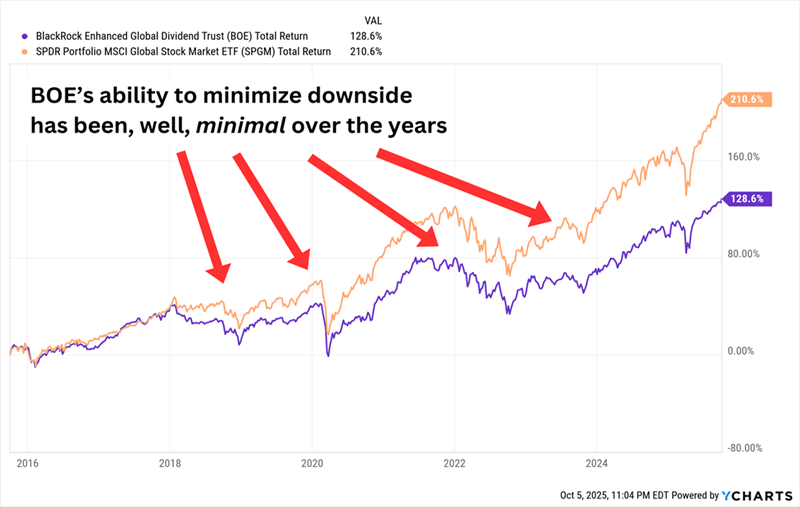
An 8.7% discount to NAV would seem to give us an edge right now, but it’s a shallower markdown than its longer-term 11% average.
BlackRock Resources & Commodities Strategy Trust (BCX)
Distribution Rate: 8.1%
Many sector ETFs and mutual funds are usually faithful to one slice of the market. We buy technology funds for technology stocks, and bank funds for bank stocks.
But CEFs like the BlackRock Resources & Commodities Strategy Trust (BCX) aren’t afraid to “cross the streams.”
BCX primarily invests in stocks “issued by commodity or natural resources companies,” meaning that the portfolio straddles the energy and materials sectors. The management team has assembled a tight portfolio of just 45 companies including integrated energy majors like Shell (SHEL) and Exxon Mobil (XOM), but also metals and minerals specialists like Wheaton Precious Metals (WPM) and Freeport McMoRan (FCX). The fund also may invest in derivatives, and it also sells covered calls to enhance its dividend yield.
The result?
Sometimes, BCX Gives Us the Best of Both Worlds
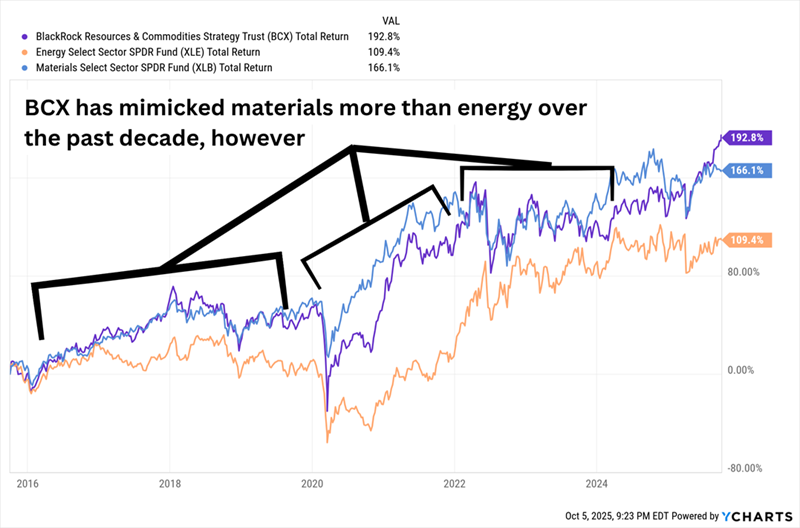
It’s not always that way. Longer-term, BCX has struggled to capture some of the biggest moves in metals, at least in part because of its covered-call strategy.
Like with many CEFs, the best chance for success is buying while the fund is cheap. We can currently buy BlackRock’s fund for a 6% discount, but it’s not really a deal compared to its long-term average discount of 10%.
ClearBridge Energy Midstream Opportunity Fund (EMO)
Distribution Rate: 9.7%
We get a more targeted energy play (and the highest yield of the bunch, at nearly 10%) from the ClearBridge Energy Midstream Opportunity Fund (EMO).
Co-Managers Peter Vanderlee and Patrick McElroy own just 20 companies. But it’s a who’s who of midstream companies (firms that operate pipelines, storage, terminals and other energy assets), including regular stocks such as Targa Resources (TRGP) and ONEOK (OKE), as well as master limited partnerships (MLPs) such as Energy Transfer LP (ET) and Enterprise Products Partners LP (EPD).
Unlike with the other CEFs mentioned above, EMO’s holdings do a lot of the talking as it pertains to the monthly distribution. MLPs are among some of the highest-yielding securities in the stock market. But the fund still pays more than most MLP ETFs thanks to high leverage of nearly 30%.
EMO trails its benchmark, the Alerian MLP Index—represented in the chart below by the Alerian MLP ETF (AMLP)—by 30 percentage points since inception in 2011. But since 2023 EMO has nearly doubled the return of AMLP, thanks to its aggressive leverage.
EMO Outperforms in an Energy Bull Market
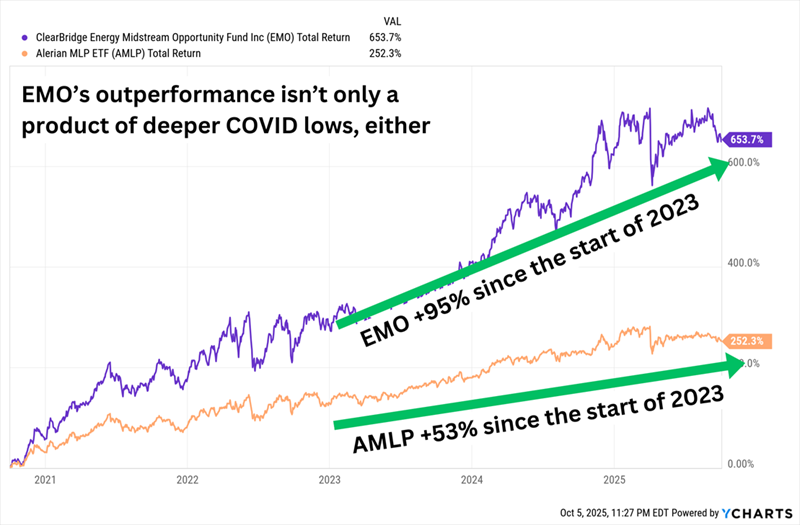
EMO has the deepest discount on this list—we currently can buy shares at 91 cents on the dollar. But thanks to its hot performance, it’s actually expensive in historical terms, trading well above its longer-term 15% average discount.
A Fully Paid Retirement on Just $500,000?!
Some of these CEFs aren’t as cheap as we might like, but they have two vital components we need if we plan to retire on income checks alone: 1.) yields of 8%+, and 2.) monthly distributions.
In fact, these two characteristics are the cornerstones of my 8% Monthly Payer Portfolio.
Why 8%? The math is easy to understand:
- A $500,000 nest egg could earn $40,000—depending on where you live, that could be enough for a fully paid retirement on its own.
- You could generate a $60,000 annual dividend “salary” from a $750,000 nest egg.
- And if you have managed to stow away a cool million bucks to work with, the 8% Monthly Payer Portfolio could pay you an equally cool $80,000 in dividend income every year.
But what makes this portfolio really sing is the monthly frequency of dividends. That means we’re getting paid every bit as frequently as we’re paying the bills.
No complex accounting from one month to the next. No dividend “ladders.” Just money in our accounts every 30 days or so.
It’s like getting a regular salary—without the job!
Don’t miss out on my favorite income plays while you can still get in at bargain prices. Click here for details and turn your portfolio into a monthly dividend machine.