Over a decade ago, closed-end funds (CEFs) helped me achieve financial independence. Since then I’ve seen hundreds of other people use them to get there, too. I’m certain these unloved funds—payers of 8%+ dividends—can help you do the same.
Well, I shouldn’t say “unloved.” “Misunderstood” is more accurate.
As I write this, the CEFs tracked by my CEF Insider service yield 8.3% on average. But because the CEF market is small and off the radar to most folks, many don’t know what to look for in these high-yielding funds—if they know about them at all.
Today we’re going to change that by looking at a couple common mistakes people make when choosing CEFs, and how these errors can lead them to miss out on 8%+ yielders that offer sustainable payouts and strong gain potential, too.
CEF Mistake No. 1: Judging CEFs by Price Alone
The biggest mistake I’ve seen people make is actually kind of silly when you stop and think about it. They’re looking at the wrong performance charts.
First Looks Can Be Deceiving
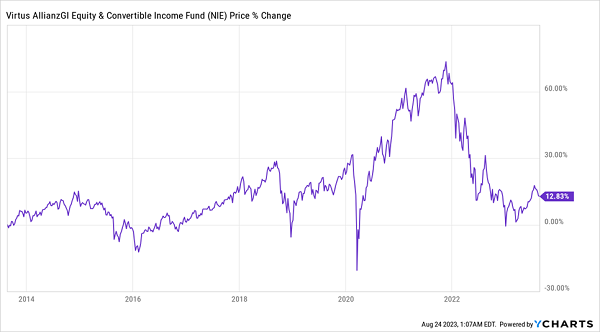
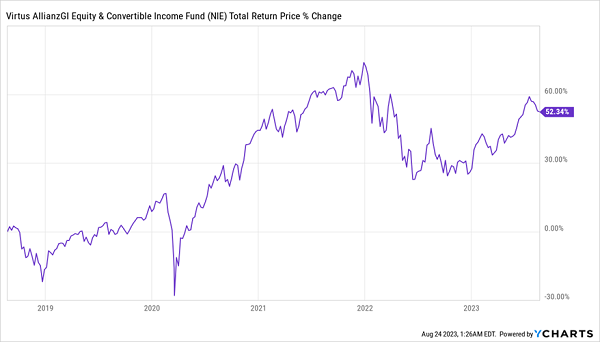
According to this, the performance of the Virtus Equity & Convertible Income Fund (NIE) is pretty uninspiring. A 12% gain in a decade is savings-account-level stuff, yet this is supposed to be a fund of stocks and convertible bonds that boost income way higher.
Thing is, this chart only focuses on price gains. It’s the kind of chart you see on Google Finance or Yahoo Finance; it’s the kind of chart brokers use and that big financial publications rely on.
It’s also only part of the story, at best.
Dividends Change the Picture
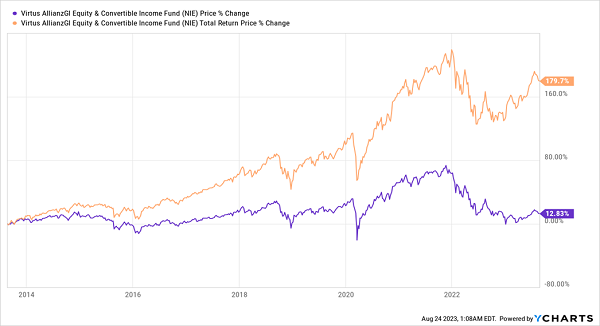
Here we see the price change for NIE over the last decade alongside the total return price. That’s the total cumulative profit NIE shareholders received over this period including dividends, which price charts ignore. That’s right, all the charts most people rely on forget about income! If we look at just the price chart for any dividend-paying investment, it’s only going to give us part of the picture.
This can make a big difference with CEFs like NIE, which yields 9.6%. It’s even a game-changer with the S&P 500, which only yields around 1.4% now.
S&P Profits Understated
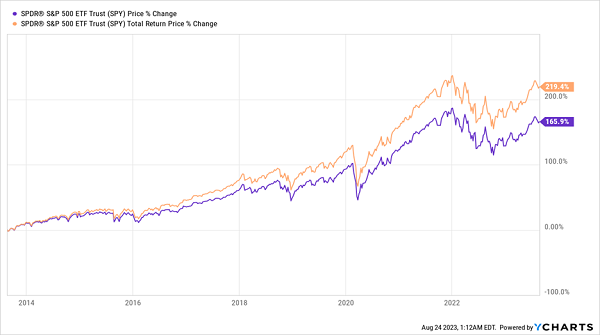
The data point everyone focuses on is the 165.9% price return over a decade, but the S&P 500 has actually delivered a 219.4% total return (including dividends).
The gap with CEFs is so wide because of their big payouts. Going back to NIE, this hybrid debt/stock fund yielding 9.6% has delivered a 10.3% annualized return, with most of that as dividends. But search it on Yahoo Finance (or any other popular stock searching platform) and you see this:
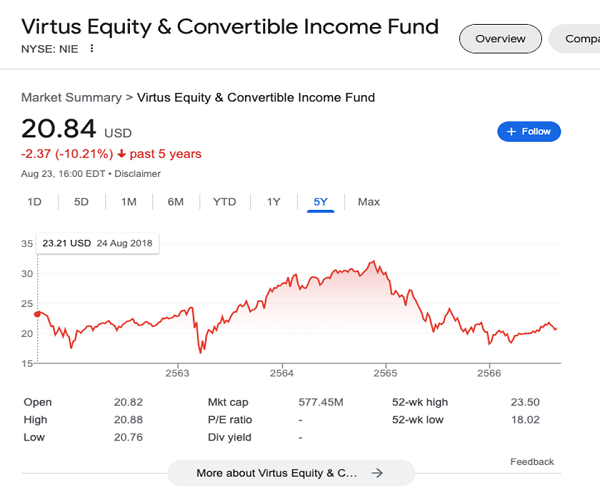
Source: Google Finance
That’s very different from NIE’s actual 8.9% annualized return over that five-year period, when we add in dividends:
NIE Is a Proven Money Maker
When we add payouts, we get a much better performance. But this doesn’t please everyone, as NIE did underperform the S&P 500 over that period. Which leads me to:
CEF Mistake No. 2: Comparing CEFs to the Wrong Benchmark
This is a common criticism of CEFs: they don’t beat the index! Too bad it’s often wrong.
NIE’s portfolio is roughly 56% convertible bonds and 40% high-yield bonds, so it’s not a stock fund. While its convertible bonds have equity-like characteristics, and NIE does hold stocks in some companies (largely as a result of its convertible bonds changing over to stocks), comparing it to the S&P 500 makes no sense.
This is no secret; it’s just that most people don’t read the fine print. NIE’s composite benchmark “consists of 40% ICE BofA U.S. Convertibles Index [representing convertible securities], 45% ICE BofA U.S. High Yield BB-B Constrained Index [representing high-yield bonds] and 15% Credit Suisse Leveraged Loan Index.” This is something NIE discloses in its SEC filings regularly (I’m taking this from NIE’s Form N-CSR, filed with the SEC on October 11, 2022, on page 5, but they disclose this yearly).
A fairer comparison would be to stack NIE up against ETFs that track indexes like these, like the iShares Convertible Bond ETF (ICVT), SPDR Bloomberg High Yield Bond ETF (JNK) and Invesco Senior Loan ETF (BKLN). Weight the returns of these long term, and if NIE has done better, it’s a winner. And indeed it is:
NIE Outruns Its Real Benchmarks
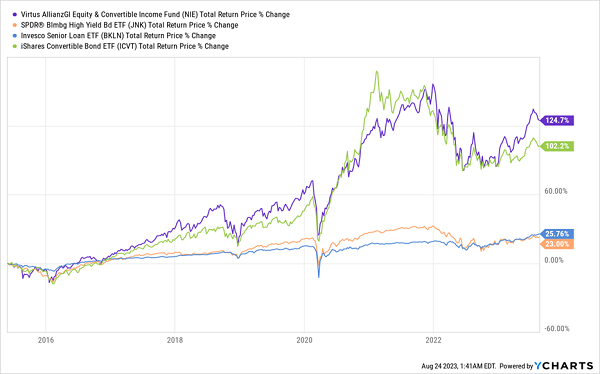
NIE is an outperformer, providing exposure to the income of convertible and corporate bonds and diversification outside of stocks. Plus its discount to net asset value (NAV, or the value of the holdings in its portfolio) is 10.1%, so we’re buying NIE’s portfolio for just 90 cents on the dollar, which is great for us—but makes no sense for a fund that’s performed as well as this one has.
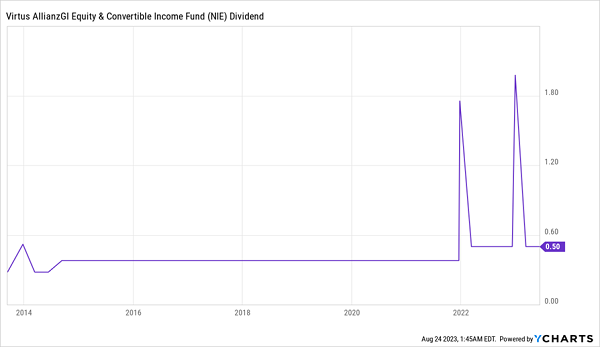
When investors realize this, NIE’s discount will disappear. But we want to buy before then so we can get its big income stream (bigger than the yields on all the ETFs above, by the way). NIE’s appeal doesn’t end there: that 9.8% dividend yield has been growing. It has a history of paying big special dividends, too.
NIE Payouts Rising
Now that we’ve talked about errors to avoid when buying a CEF, in next Monday’s Contrarian Outlook article I’m going to dig into three things you should look for when buying a CEF.
5 More “Financial Independence” CEFs Paying Massive (10.2%!) Yields
My top CEFs to buy now trade at ridiculous—and totally unusual—discounts, and pay huge 10.2% dividends, too!
These are the kinds of discounts and yields that can deliver true financial independence. Which is why I urge you to act now—before these absurd discounts close and this opportunity races away from us.