There’s a lot of buzz about beta these days. Should we contrary-minded investors fade the fad?
Beta is industry slang for volatility. It’s generally used when judging a particular investment or portfolio with respect to the broader market, with 1.0 as the benchmark. Lower is better, as that (in theory) means the issue is less volatile than the market.
For example, Campbell Soup (CPB) has a listed beta of just 0.37 – which (again, in theory) means CPB shares are 63% less volatile than the overall market. If the S&P drops 2% in a day, CPB shares should hold steadier and lose less than 1% or so.
Steady share prices are especially desirable traits in this global manhunt for yield. After all, if stocks are being bought as bond proxies, investors don’t actually want them to behave like stocks! They simply want to collect their dividends, receive their yearly payout hikes and watch their tickers every day without much drama.
This inspired Fidelity Investments to launch not one, not two, but six ETFs last month with “smart beta” in mind. Funds like the Fidelity Core Dividend ETF (FDVV) and the Fidelity Low Volatility Factor ETF (FDLO) are geared to give investors a one-click way to put their portfolio at ease.
But Beta Chasers Have 2 Big Problems
For starters, ETF launches are often screaming contrary indicators. They are products crafted by marketing departments rather than research teams, catering to hot investment fads.
New ETFs suck investors into buying high – and later selling low. Consider these recent examples from Barron’s:
- 136 tech funds launched as the dot-com bubble was peaking – and 31 closed in 2002 as tech was finally ready to rally.
- 37 real estate funds launched at the top of the housing bubble in 2007 – and 16 later closed in 2009 as the sector bottomed.
- 10 energy MLP funds launched in 2014 as oil prices were peaking.
And there’s even a bigger flaw with the “low beta” approach: You can’t pay your bills with beta.
I warned you about Campbell’s last month. The soup maker’s profits have been grinding sideways for years, yet investors had puzzlingly bid its yield down to multi-year lows in their search for payouts and low beta.
But low beta is no buffer for principal losses. It may provide comfort on any given day that you check your stock prices, but that won’t prevent your stock from slowly grinding lower.
Check out the case of Campbell’s, which has shed 12.5% over the last six months – during which time its beta went from low, to even lower!
Mmm, Mmm – No Good!
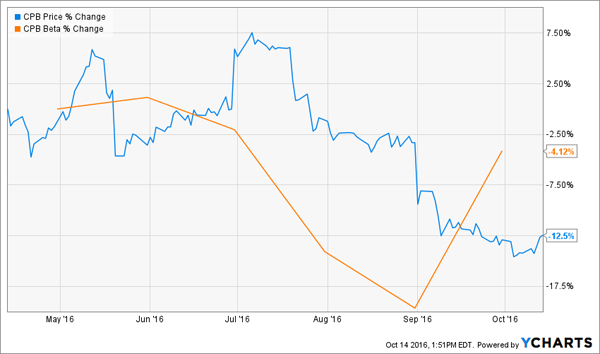
If you’re scratching your head wondering why you’re seeing losses on low beta stocks you own, this is why. Low beta may protect you on any given day, but it’s meaningless over any real time horizon.
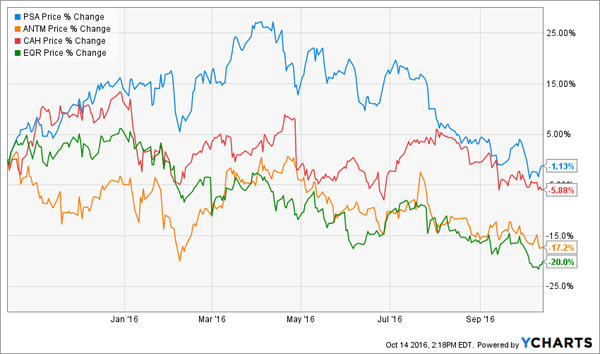
Of course you don’t have to take my word for it. Just ask anyone who owns Public Storage (PSA), Anthem (ANTM), Cardinal Health (CAH) or Equity Residential (EQR) – they’re in the red year-to-date despite low betas (less than 0.64) and respectable yields (2.1% to 3.4%):
Four More Low Beta Dogs
Better Than Beta: Buy Dividend Payers Due for “Catch Up”
While low beta names are getting the headlines and hot money today, tomorrow’s top performers will be the stocks with prices set to “catch up” with their soaring dividends as the global manhunt for yield intensifies.
Speaking of which check out this dividend chart – do you see a pattern?
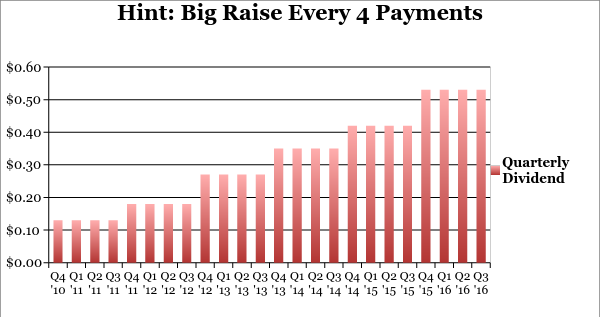
On October 27, we’ll probably be able to update the chart above with one more red bar, at an all-time high. That’s when my next Hidden Yields recommendation holds its next earnings conference call – and we receive our raise for the next 12 months.
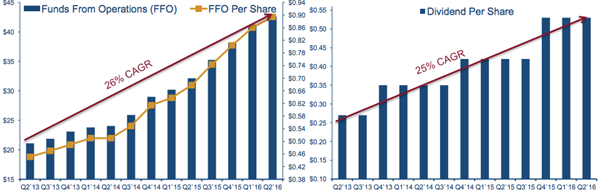
I’m optimistic because management has grown its dividend per share at a 25% compounded annual growth rate for the last three years. And it’s forecasting funds from operations (FFO) will clock in 26% higher this year over last. FFO is the real estate investment trust (REIT) equivalent of excess cash flow. The long-term driver of dividends for any other REIT is FFO.
FFO and Dividends Climb Together
Add it all up, and the CEO is primed to delight Wall Street and shareholders alike when he speaks to them next Thursday. And the stock market, being a “forward-looking” entity, should have this already priced into shares. Fortunately headline-driven investors are fretting needlessly about our hidden gem and we have a one-week window to buy shares on sale. Click here and to receive the full details this Friday, along with information about three more undercover perennial payout growers.