Double-digit dividends are rare. A sky-high yield of 27.2% is an outright income unicorn.
Only in the merry world of closed-end funds (CEFs) would we see such a tale. It’s enabled by talented money managers who, thanks to wide investment mandates, serve as the Willy Wonkas of the CEF factory.
These managers have an endless bag of tricks at their disposal. They can put options to work. They can “double down” on their own bets. They can double, triple and even quadruple the yield on traditional investing strategies, leading to average yields in the high single digits and stretching all the way to 27.2%. (For real!)
But they still can’t seem to get any respect.
Just a few weeks ago, year-to-date inflows into exchange-traded funds (ETFs) eclipsed $500 billion, shattering 2020’s full-year record inflows (with five months to go!) and putting the U.S. ETF industry at a whopping $6.6 trillion in global assets and counting.
That’s a lot of money, and it still doesn’t make ETFs the most popular investment vehicle on the planet—not by a longshot. Mutual funds account for roughly three times the assets, at $21.3 trillion. And CEFs? You have to squint to see them.
No Love for the CEF Factory
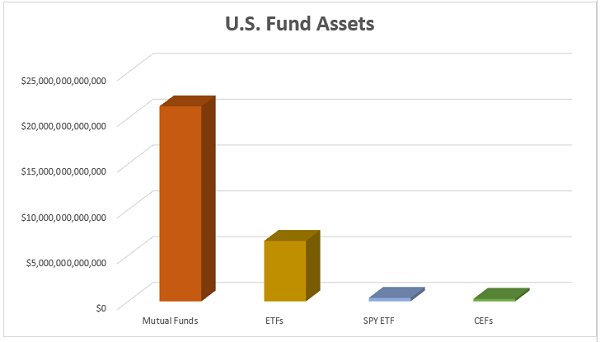
Source: Contrarian Outlook
The CEF universe is so small that it’s difficult to even get accurate inflow data throughout the year. Closed-end fund assets stood at $279 billion at the start of 2021; even at the same rate of growth of ETFs, they wouldn’t be anywhere even remotely close to mutual funds or ETFs.
In fact, the entirety of the CEF world would still be smaller than the SPDR S&P 500 ETF Trust (SPY)—admittedly, the largest ETF by assets, but a single ETF, nonetheless.
That’s a shame. Because that’s trillions of dollars that are missing out on what often is the superior fund type, especially if you’re focused on income. Consider what all closed-end funds can do:
- CEFs typically deliver higher dividends.
- Many CEFs pay monthly (not just quarterly).
- They have fixed pools of shares, which means they often trade at discounts to their net asset values (NAVs). That means you can buy dividend stocks for less than they would cost individually on the market.
- CEFs can use debt leverage to make more concentrated bets on their highest-conviction picks.
- They can trade options to further amplify the income they can generate.
I recently demonstrated that last point to readers, highlighting an incredible CEF that allows you to collect more than 6% annually while someone else trades Nasdaq-100 options for you.
But if that’s too exotic for you, don’t worry—you can still easily collect yields of between 7.3% to 27.2% in pretty straightforward equity CEFs. Have a look.
Growth Stocks
ETFs with growth strategies such as the Vanguard Growth ETF (VUG) and Schwab US Large-Cap Growth ETF (SCHG) currently deliver meager yields of roughly 0.5% each. They’re growth funds—what else did you expect?
I’m guessing you didn’t expect 8% in annual income, but that’s exactly what you get with Liberty All-Star Growth (ASG, 7.9% yield).
You also get a much wider view of the market than with VUG or SCHG. Liberty All-Star Growth actually combines three growth-style investment managers: one focused on large-caps, another focused on “mids,” and the third with an eye out for small-cap opportunities.
It’s an actively managed fund, so it’s bound to play favorites. Tech makes up 28% of the fund, healthcare 24%, and consumer discretionary another 15%. Fortunately, the portfolio isn’t beholden to any one stock. The two largest holdings right now are outsourced property services firm FirstService (FSV) and genetic testing company Natera (NTRA)—a pair of mid-caps that each account for just 2% of assets.
ASG doesn’t trade options, and its leverage right now is negligible, so how does it manage to turn these potential-packed stocks into income producers?
With a sleight of hand.
The lion’s share of ASG’s healthy distributions are actually long-term capital gains and non-qualified dividends, both of which have worse tax rates than qualified dividends. In fact, what you’re getting is more or less on-par performance with typical growth strategies, just distributed in a different manner.
VUG and ASG Often Are Neck-and-Neck
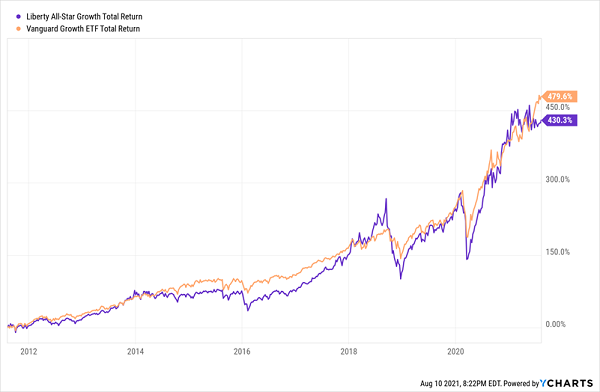
It’s the kind of fund that’s worth considering for returns in steady sums. But we should demand a discount, and that’s not available right now. ASG trades exactly at its NAV as I write.
Healthcare Stocks
You can find cheaper prices on equity CEFs right now if you’re willing to get a little more specific.
Consider Tekla Healthcare Investors (HQH, 7.3% yield) and Tekla Life Sciences Investors (HQL, 7.5% yield). The former trades at a modest 1% discount, the latter trades at 5% below NAV.
Similar to ASG, most of the distributions aren’t coming from qualified dividends—it’s primarily capital gains and return of capital. No leverage, no options, so what matters is what’s in the bag.
Despite different names, they both sport fairly similar portfolios. They’re both overweight biotechnology, at 63% for HQH and 76% for HQL, and have double-digit weightings in pharmaceuticals. The rest of their portfolios are peppered around healthcare equipment, life sciences tools and services, health insurers and other types of companies. They mostly hold common stocks, though they’ll also carry convertible preferreds, milestone interests, short-term investments and trace amounts of other assets.
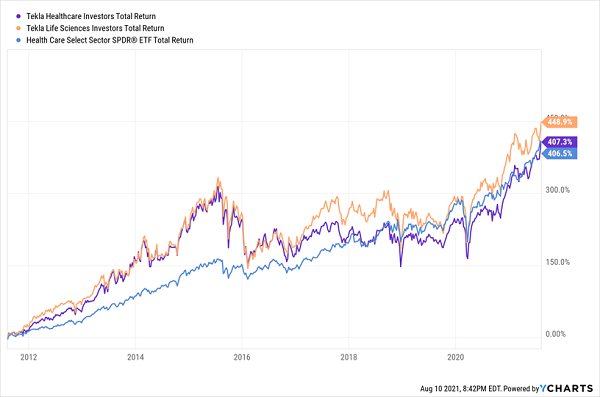
Life Sciences, likely because of its heavier tilt toward biotech, has the better long-term track record. Both perform admirably, but again, because they’re not juggernauts, it’s best to get them when they’re cheap.
HQH and HQL Hold Their Own
International Stocks
For wild distributions and lip-smacking discounts, we must grab our passports. The India Fund (IFN, 10.4% yield) presently trades at a 9% discount to its NAV, meaning we’re buying this single-country fund’s assets at roughly 91 cents on the dollar.
There’s nothing surprising about how this Aberdeen CEF goes about business. Actively managed single-country funds tend to have a tight number of holdings, and that’s the case for IFN and its roughly 40-stock portfolio. Financials are a big part of many emerging-market funds, and such is the case here, with banks representing the largest sector at 26.6% of the fund.
But technology is an unsurprisingly big component of The India Fund, too—IT consulting services firms Infosys (INFY) and Tata Consultancy make up a large part of IFN’s 21% weight in tech.
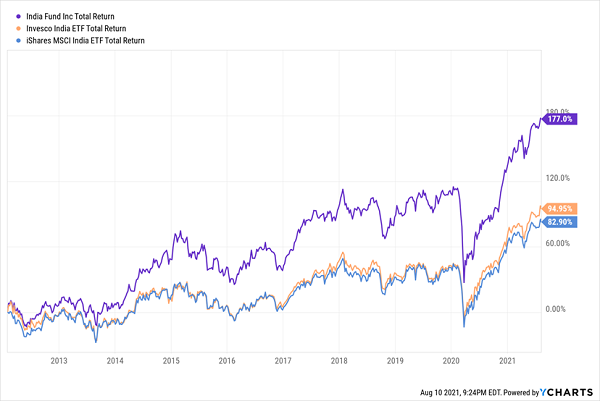
And here, we the value-add of active management:
The India Fund Is THE India Fund
The biggest eye-opener of all, though, is Templeton Dragon Fund (TDF) and its monster 27.2% yield.
This Is No Paper Dragon
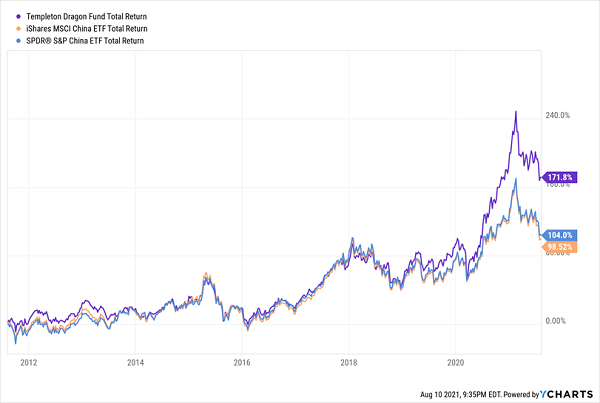
Templeton very much represents the “new” China. This is an emerging market that has long been nearing developed status, and it boasts a burgeoning middle class that is tech-savvy and ready to spend.
Consumer cyclical stocks make up a whopping 37% of holdings right now, led by e-commerce titan Alibaba (BABA) and JD.com (JD). That’s followed by a 21% weight in communication services firms like Tencent (TCEHY).
And that 27.2% yield?
Just like the rest of these funds, this is almost completely long-term gains and return of capital. Consider that in 2020, TDF doled out a little more than $5.82 per share in distributions… about 15 cents of which was qualified dividends.
However, we should note that the distributions provided by TDF and IFM are “lumpy” payouts. These funds pay nothing all year and then kick-out a year-end distribution.
We don’t get paid dividends throughout the year. Heck, we don’t even know what the yield for the year will be until it is announced (almost) after the fact. That’s a tough way to plan retirement income.
A better bet? Equally good funds that pay steady dividends every single month.
The “A” Squad: Monthly Payers Doling Out 7%-Plus Yields
As I said, what’s really strange about TDF—and thus, not ideal for income investors—is that those distributions come but twice a year… in September and December.
Imagine trying to plan your retirement budget around that schedule!
Or better yet… don’t.
All of these “B” funds have the best of one world, but a shortcoming somewhere else. High yield, but a bizarre payment schedule. Good discount, but merely OK long-term performance.
But my “A” squad has everything income investors need, right here, right now. No settling.
My “7% Monthly Payer Portfolio” is an elite set of high-income, high-frequency dividend payers that, at current prices, are smack-dab in the middle of our ideal “buy zone.” And as the name suggests, these 7% dividends are paid out to investors each and every month.
Many of the picks in my “7% Monthly Payer Portfolio” leverage the power of steady-Eddie holdings to generate not just massive yields, but shockingly aggressive price performance. That allows us to do the unthinkable from an income strategy: double our money much more quickly than traditional blue-chips-and-mutual-funds portfolios.
These dividends aren’t just good.
They’re not just great, either.
They’re downright life-changing.
If you drop $500K—less than half what many financial gurus suggest you need to retire—into this powerful portfolio now, you’d kick-start a $35,000 annual income stream. That’s nearly $3,000 a month in regular income checks!
The time to get in is now, while you can still buy these names at bargain prices. Click here to get everything you need—names, tickers, complete dividend histories and more—instantly!