It’s a statement we hear from readers a lot: “I’m worried about another 2008.”
I get it. After all, we’re all 11 years older and have that much less time to recover from a crash. So today we’re going to cut through the noise and look at whether there really is something to worry about here.
We’ll do it by comparing, point for point, what’s happening now to the run-up to the 2008 crash. I think you’ll be surprised by the results.
Let’s dive in.
This Happened in 2006—and Again Last March
We started hearing about the inverted yield curve—when yields on short-term Treasuries move higher than those on longer-term ones—seven months ago. It’s a reliable early warning, typically cropping up a year to two before a recession starts.
Case in point: the last time the yield curve inverted, in August 2006. We know what happened to stocks after that:
Early Warnings Ring True
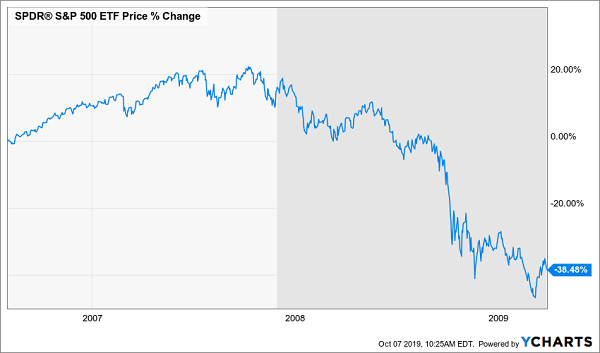
The dark-gray side of the chart indicates when the recession officially began, 14 months after the warning sign first came.
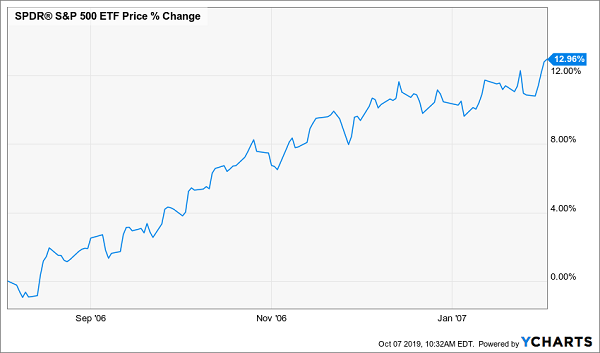
Overlaying that timeline with the present day, we’d have seven more months until the recession starts, and stocks would be at the top. I say that because, in those same seven months after the start of the inverted yield curve in 2006, stocks kept going up.
Investors Ignored the Warning Signs in ‘06/’07 …
That’s our first clue that this classic recession indicator may be wrong (or early). Over the last seven months, stocks have gone up—but just barely:
… But Not in 2019
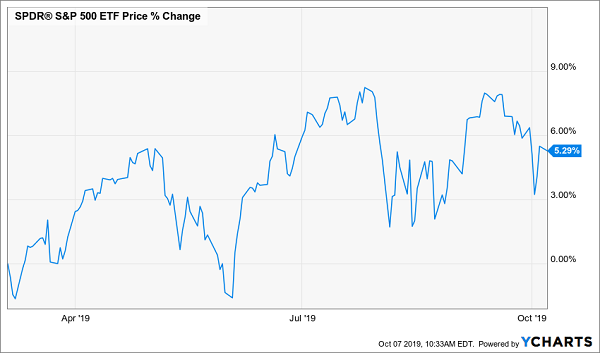
What’s more, stocks are barely up since the start of 2018, due to that year’s bear market (2005 and 2006 were both strong years for stocks). This suggests that a lot of recession fear may already be priced in.
And with the economy as a whole, the odds of a looming recession look much lower than you’d expect.
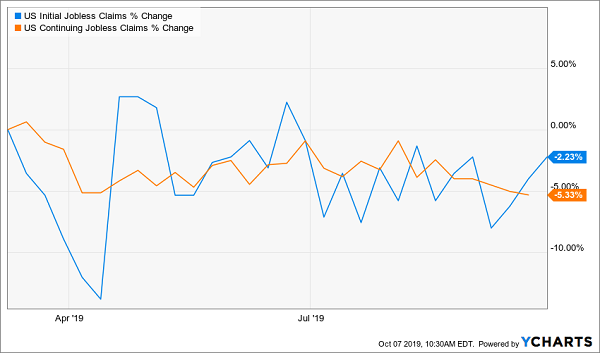
The Job Scene in 2007—and Now
In America, the most important indicator is jobs—because consumers are the ones whom companies depend on to buy their stuff.
2007’s Job Picture Darkens
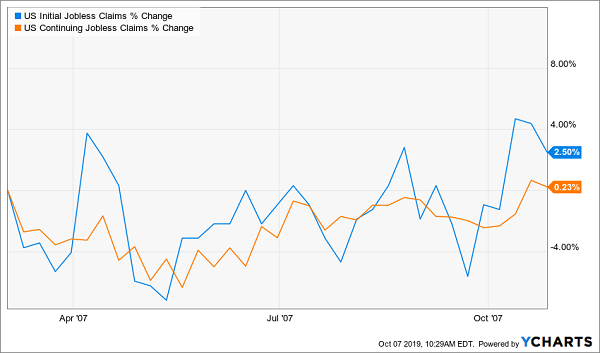
In 2007, the job market had already started weakening, as you can see in the rise of jobless claims above. This isn’t a surprise: a trickle of doubt and belt-tightening tends to come before a full-on recession. Yet when we look at jobless claims now, things are fine—not at all like what we saw back then.
No Recession Here …
Wages and salaries are still rising, too:
… Or Here
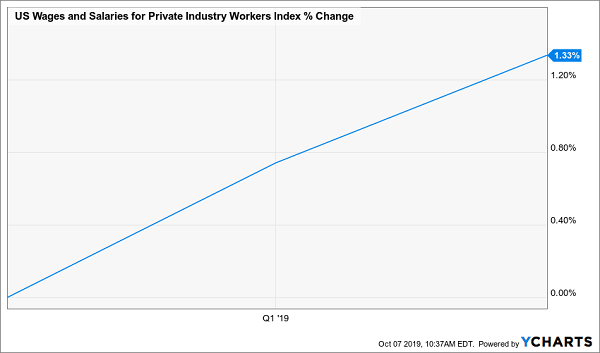
Workers did see their pay go up in the same period in 2007, but this wasn’t a change in real, after-inflation dollars, because prices were soaring back then:
Inflation Soared in 2007 …
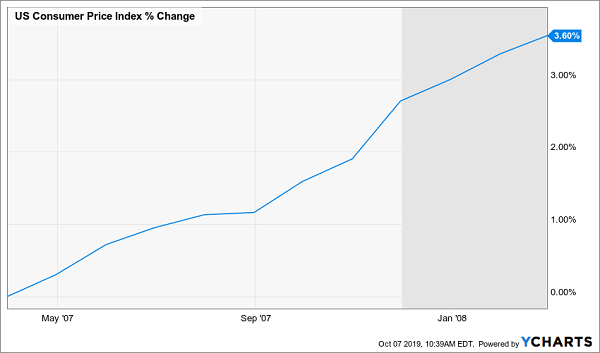
On the other hand, inflation is now much more modest, with prices rising at less than half the rate of 2006:
… But Is a Paper Tiger in 2019
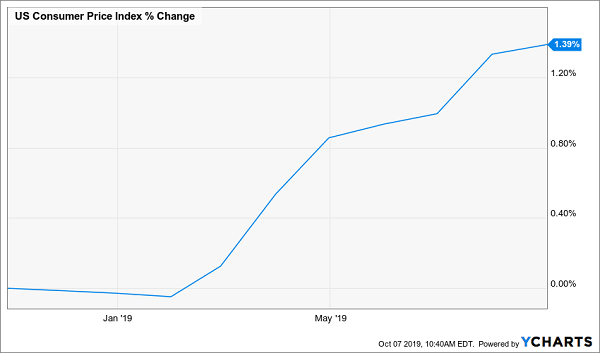
High inflation and rising incomes and jobless claims are a risky cocktail, because they indicate a bubbly market. Today, we have low inflation, moderately rising incomes and falling jobless claims, suggesting a recession isn’t coming in the next seven months.
The next big question: are consumers still spending? In 2006, we didn’t see corporate revenue rise as much as we’re seeing it grow now. And, much more importantly, revenue growth has stayed solid until recently.
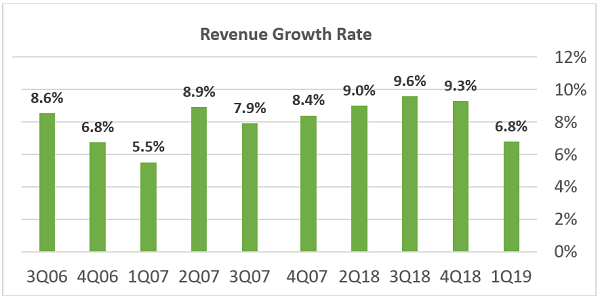
Source: S&P, CEF Insider
However, there’s one big thing to consider: the first quarter’s weakness may have been a result of the trade war with China.
The Trade War: Today’s Mortgage Meltdown?
Which brings us to our final big question: is the trade war bad enough to stop the economy cold? Let’s take a look.
Tariffs are currently set at 10% to 50% on $630 billion of Chinese imports. All told, they’ll cost US consumers $115 billion a year, or about $30 per month per American.
Can the economy handle that?
First, it’s important to remember that the proceeds from those tariffs won’t disappear. Sure, consumers will pay an extra $115 billion, but the government will use that money to buy goods and services.
Still, let’s say this cash did vanish. Right now, US GDP is $20 trillion—meaning the tariffs can cause, at worst, a 0.57% decline in the economy. Since the US economy is growing at 2.5%, we can say that the trade war may be keeping our growth below 3%, but it isn’t making growth go negative.
However, if the trade war escalates to the point that Americans stop spending, a recession could come. Until then, the data tells us there’s little cause for worry and it’s time to buy, not sell—especially if you buy high-yielding closed-end funds (CEFs).
4 CEFs Perfect for a Nervous Market (Yields Up to 10.7%)
So which CEFs should we buy?
Simple: the 4 funds I’ll share with you right here. They have 2 critical strengths that help them crush stocks in any market weather:
- Big dividends: I’m talking an 8.7% average yield. Income like that is crucial because you can sail through a recession and collect your big cash payouts without having to sell a single share. What’s more, other investors, eager for a cash stream to hedge their portfolios, will jump in, pushing these funds’ prices up.
- Big discounts: Each of these 4 funds trades at a serious discount to the value of its portfolio. In a pullback, these big discounts mean our 4 funds will likely trade flat—and we’ll still collect their huge 8.7% payouts!
To see what a massive payout can do for you in a pullback, consider the 4th fund on my list: it yields an incredible 10.7% now, and its payout has skyrocketed 150% in the past decade!
A Rare 10.7% Dividend That Soars
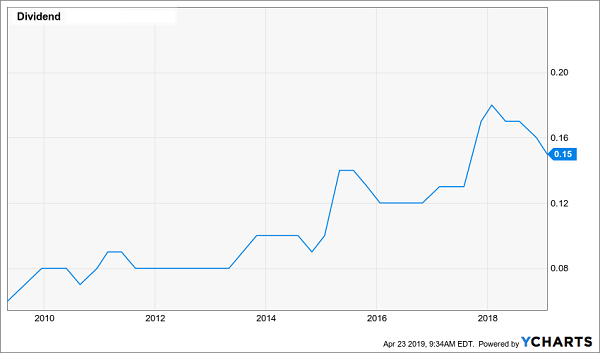
And get this: even if this fund just trades flat from here, you’re still beating the market’s average historical yearly return in dividends alone, thanks to its outsized 10.7% payout!
If that’s not the definition of a win-win, I don’t know what is.
Full details on all 4 of these “recession-resistant” income plays are waiting for you now. Don’t miss this rare opportunity to score them at a bargain. Click here and I’ll give you names, ticker symbols, dividend histories and everything I have on each of these 4 cash-rich CEFs.