
Is there anything better than a closed-end fund (CEF) paying 7% or more in dividends? I’ll tell you what: it’s when that fund is discounted by 10% or more with respect to the fair value of its portfolio. This is a feature, a fantastic one, of CEFs: they tend to trade at discounts to their fair values.
Why do CEF values wander from the underlying value of their portfolios? It’s because these vehicles issue fixed amounts of shares, so when investors are greedy, they can bid up the prices of these funds in excess of their net asset values, or NAVs. CEFs can trade at premiums, which means a fund could be changing hands for $1.05 or even $1.10 on the dollar.
As contrarians, we prefer to demand discounts, and if we’re patient enough, fear will enter the system, as it has today. We’ll see closed-end funds trading at discounts to their net asset value. In this case, we’re looking at funds trading for 90 cents on the dollar or even better.
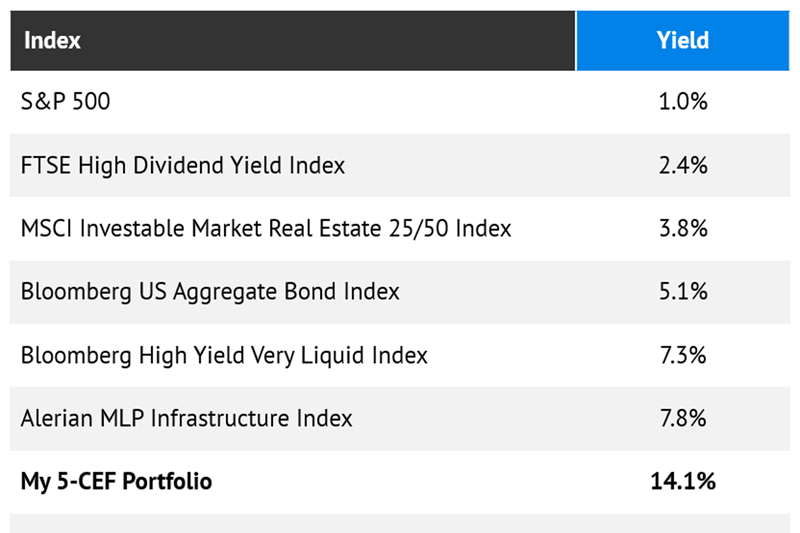
Right this minute, we can lock down five super-sized yields of between 7% and 25% while paying as little as 56 cents on the dollar for the assets these CEFs hold.
That’s an “average” 14.1% yield that puts most high-yield investment classes to shame:
But the deals in CEF-land are getting even cheaper thanks to chaos across different parts of the market.
Rising interest rates have sent bonds spiraling—and widened CEF discounts to NAV even further. So we could buy vanilla bond ETFs … or we could buy the exact same assets at an even deeper discount.
And while the S&P 500 and Nasdaq are hitting new highs, all is not well in the stock market. Several market-breadth gauges—the number of new 52-week lows, the number of stocks trading at least 20% below 52-week highs, the number of stocks trading below their 50-day moving average and more—show that stocks are teetering. So do the expanding discounts in equity CEFs.
Let’s dig into some deals that are worth a closer look: a five-pack of funds paying us up to 25% while trading at discounts of up to 44%.
Aberdeen Municipal Income Fund (MFM)
Distribution Rate: 7.4%
Discount to NAV: 10%
Bonds of all stripes are getting bombed—including tax-friendly municipal debt. That has led to both price declines and wider discounts to NAV in numerous muni CEFs, including the Aberdeen Municipal Income Fund (MFM).
Managers Miguel Laranjeiro and Jonathan Mondillo have built a portfolio of around 850 municipal bonds from across the U.S., with debt issues from the likes of the Texas Transportation Finance Corp., Chicago Board of Education and the Washington State Health Care Facilities Authority.
MFM is specifically a high-yield muni fund, but we’re not drowning in junk. The majority of its weight is rated investment-grade, which puts it ahead of its peers. But thanks to sky-high debt leverage of around 40%, we’re still pulling 7%-plus in annual checks, paid monthly.
And It’s Paying Better Over These Past Few Years
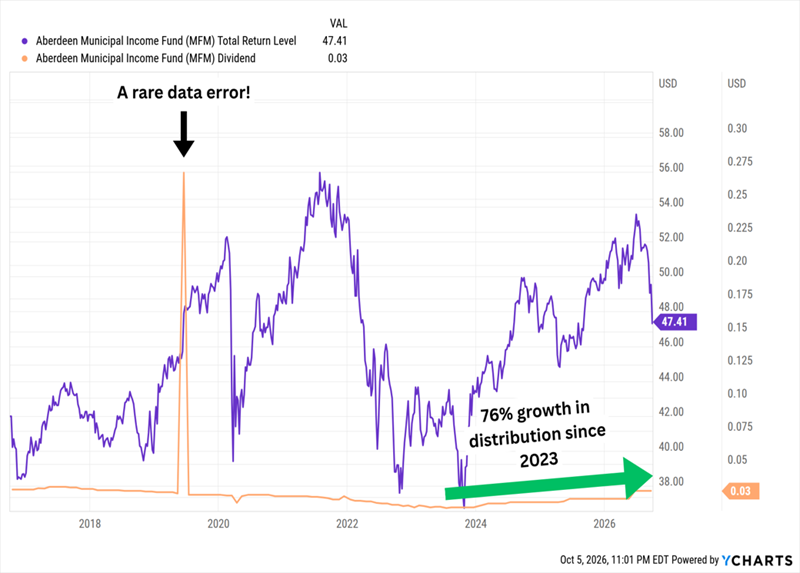
These distributions are pure income, too, which means we’re bypassing the IRS; investors paying 37% and the 3.8% Net Investment Income Tax (NIIT) are actually getting a wild 12.5% in “tax-equivalent yield,” which is how much a taxable bond fund would have to pay us for the same level of take-home yield.
I know it might be tempting to try to buy munis once rates settle down, but as I recently wrote, that’s a losing strategy. Instead, we want to buy municipal-bond CEFs when they’re cheap versus their own history. At a 10% discount to NAV, Aberdeen’s fund is a little less expensive than its more recent valuations, but it’s still a bit pricier than its five-year discount average of 11%.
General American Investors (GAM)
Distribution Rate: 10.0%
Discount to NAV: 14%
If we wanted to buy the plain ol’ S&P 500 (we don’t), we’d be buying at prices that have gotten lighter over the past year but still are above the historical norm.
Or we could buy a basket of large-cap names for a cool 86 cents on the dollar.
General American Investors (GAM) is an equity closed-end fund that’s in the same “large blend” category as the S&P. It’s a smaller portfolio of just around 70 names, but we’re still getting exposure to mega-caps like Apple (AAPL), Alphabet (GOOGL) and Berkshire Hathaway (BRK.B). Sector coverage isn’t that far off from the S&P 500—it’s a little lighter on tech, heavier on industrials, but all in all a similar “core” fund.
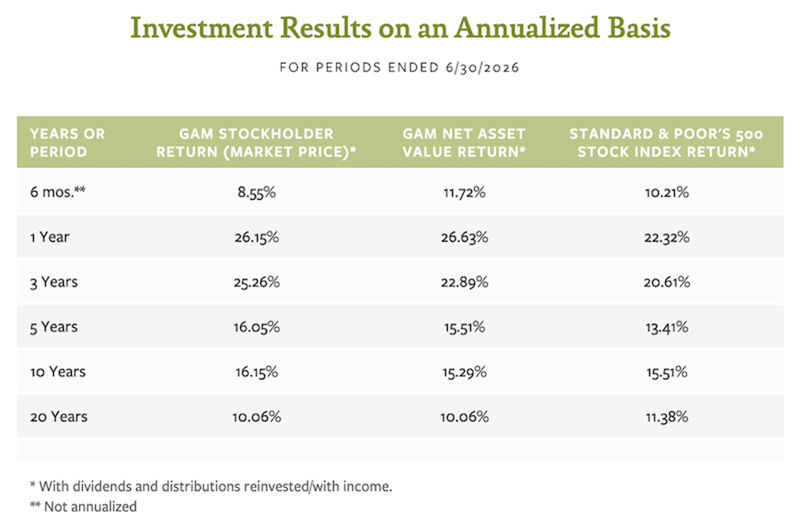
And GAM isn’t afraid to compare itself to the index, either:
Source: General American Investors Fact Sheet
GAM has been plenty competitive and even beaten the index over time. And the fund’s much longer-term performance table (published annually, most recently at the end of 2025) showed a performance edge over the past half-century.
The big difference, of course, is how that performance is delivered. Most of GAM’s returns come through the hefty 10% distribution; S&P 500’s 1% dividend is just a sliver of its overall return.
The last time I looked at General American Investors, I said we should be careful about its valuation. GAM traded at a 12% discount to NAV against a 15% five-year average markdown. GAM now trades at a 14% discount, so we’re not quite there yet, but we’re getting close.
Bluerock Private Real Estate Fund (BPRE)
Distribution Rate: 13.0%
Discount to NAV: 44%
Bluerock Private Real Estate Fund (BPRE) is the largest real estate CEF on the market at nearly $2 billion in assets under management. It invests in private real estate both directly, and through funds and other vehicles from the likes of Prudential, Carlyle and Brookfield.
BPRE itself has been around since 2012 but was private and unlisted until December 2025, when it went public on the New York Stock Exchange. And it immediately plummeted to a deep discount to the value of its admittedly illiquid real estate holdings.
Bluerock’s BPRE: Dirt-Cheap From the Drop
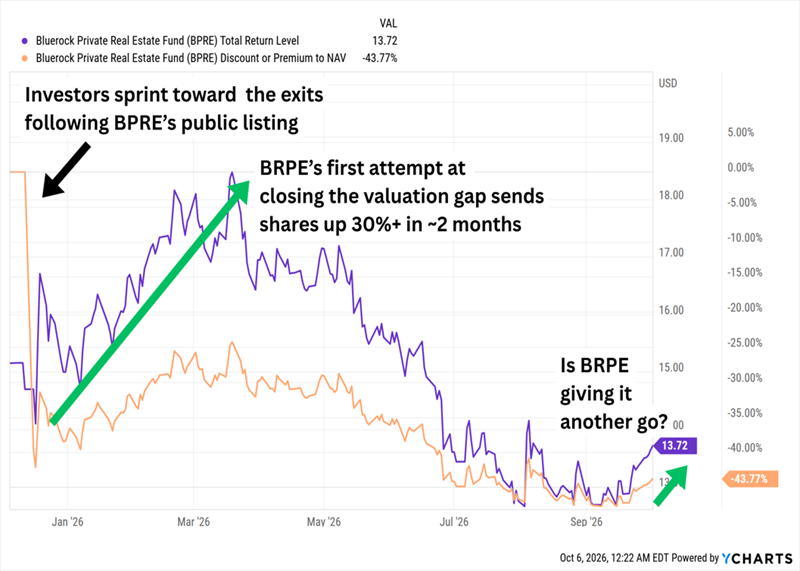
The result shouldn’t be too surprising: Investors who previously had little to no exit flexibility saw a chance to cash out.
“[The NAV discount] reflects a classic closed-end fund dynamic,” Ryan MacDonald, Bluerock Private Real Estate Fund’s portfolio manager, said back in March. “When we listed, there was a large wave of selling. In our case, investors who had been locked up for years in an interval fund who now finally have liquidity … the share price can temporarily disconnect from the underlying value.”
Should BPRE ever close that gap, shareholders will be in for a sweet surprise—and they’d earn 13% annually (paid monthly) during the wait. But there’s little to help us analyze when that will be. This is one of the most opaque real estate portfolios we’ll ever come across, BPRE’s performance has mostly run counter to the public real estate investment trust (REIT) sector, and the fund has done a lot more losing than winning in its short publicly traded life.
FS Specialty Lending Fund (FSSL)
Distribution Rate: 15.1%
Discount to NAV: 33%
FS Specialty Lending Fund (FSSL) focuses on lending to lower and core middle-market companies, dealing largely in private and opportunistic public credit.
FSSL’s portfolio currently sits at more than 80 firms, with double-digit exposure to healthcare equipment and services, commercial and professional services, capital goods, and consumer durables and apparel. The vast majority (96%) of its debt holdings are senior secured loans, and 93% are floating-rate in nature—generally a plus in a rising-rate environment.
If that sounds similar to another high-yield acronym—the business development company (BDC)—it should! FSSL was a non-traded BDC up until a year ago, when it converted to the closed-end fund structure.
Like BPRE, FSSL landed with a thud, starting with an initial discount to NAV in the mid-20s, which has since widened into the mid-30s.
Clearly, Investors Thought Less of FSSL’s Assets Than Management Did
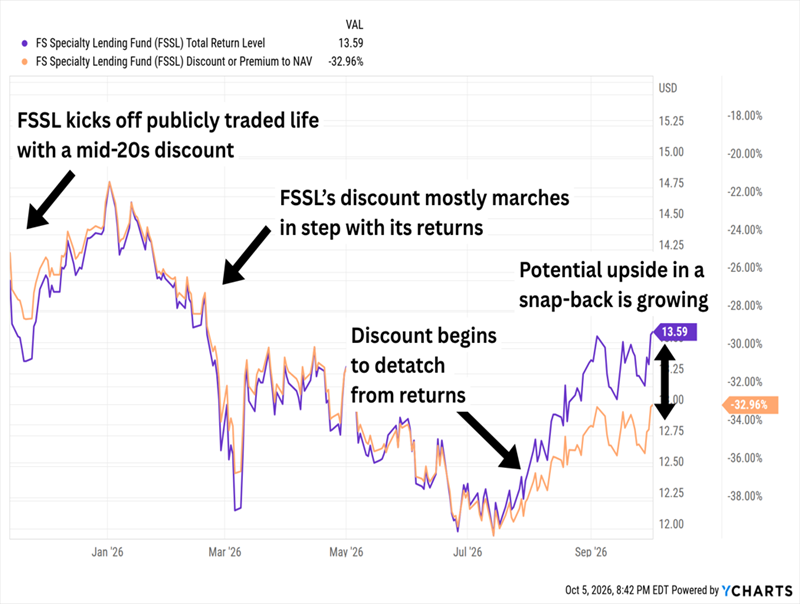
But we received a hopeful sign in August, when FSSL raised its monthly distribution by about 9%; the CEF now yields a stellar 15%.
Also like BPRE, it’s difficult to gauge what this portfolio is capable of; that’s the curse of private credit. But we can say that FSSL at least behaves like comparable businesses (other BDCs), and that it’s also directionally similar to senior-loan funds (which are primarily floating-rate in nature, too).
From that perspective, the recent Fed rate hike is a positive—as long as it’s not the start of a much bigger cycle. Long-term, rate hikes and a higher-for-longer environment can weigh on BDCs’ (and FSSL’s) portfolio companies and raise their risk of default.
But I have bigger worries with FSSL. For one, it has a relatively tight holdings roster that’s still only in the double digits. And this FS Investment Solutions fund’s strategy is relatively new—the fund was investing in U.S. energy and power up until 2023, when it switched to its current broader credit mandate. If I am looking for private credit in what has been a volatile year for the industry, I’d lean toward more established BDCs.
Guggenheim Strategic Opportunity Fund (GOF)
Distribution Rate: 25.0%
Discount to NAV: 12%
Two years ago, I called Guggenheim Strategic Opportunity Fund (GOF) “comically overpriced.”
But there’s nothing laughable about its price anymore.
Guggenheim Investments’ management is happy to do just about anything with this multisector bond fund. Right now, GOF has double-digit weightings in bank loans, corporate junk, investment-grade corporates, agency mortgage-backed securities (MBSs) and even equity. It also holds preferreds, collateralized loan obligations (CLOs), asset-backed securities (ABSs), Treasuries, even military housing bonds.
Credit quality isn’t great, but it’s not horrid, either. About two-thirds of the portfolio’s debt is junk, and of that, about half is B-rated. Leverage is moderate at around 20%. The monthly distribution is managed—historically, a majority is return of capital, but about 30%-40% is income—and hasn’t changed in more than a decade.
None of that screams “25% yield”—until we add in a 30% drop over the past year.
The Only Thing That Has Dropped More Steeply Than GOF? Its Pricing to NAV.
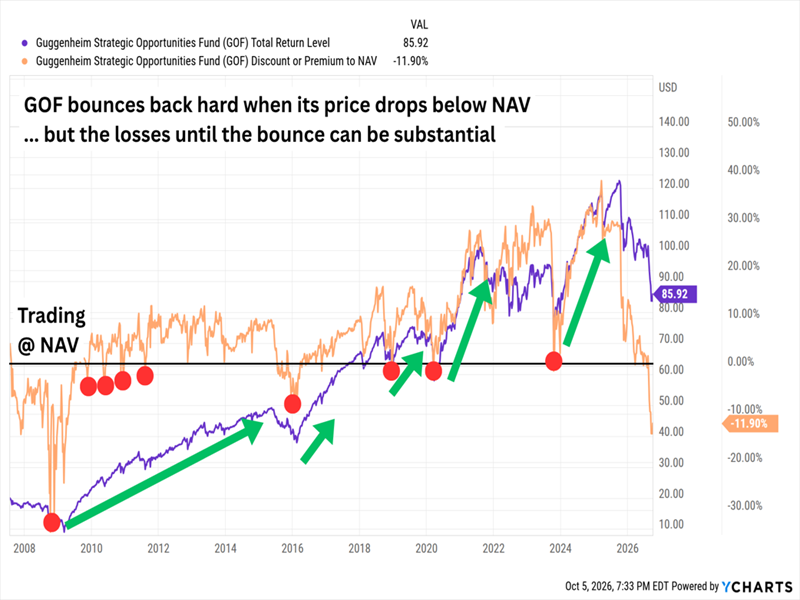
This is a fund that traded at a premium in the high 30s … but has since plummeted to a 12% discount. That’s meaningful because while GOF frequently finds its way back from premium territory to a fairer value, it’s rare for it to be priced at such a meaningful markdown.
My Favorite 12% Payer Is Hanging Out With GOF (in the Bargain Bin)
GOF isn’t the only big dividend being unfairly tossed aside. The same thing is happening with another fund I’m recommending now.
It pays a fat 12%, and it pays us monthly. But among the reasons I like it better than GOF?
- It’s far less volatile.
- It has far more long-term upside potential.
- Unlike GOF’s distribution, which has been flat for more than a decade, my favorite fund’s already-outsized payout has been growing—up 8% in the last five years, with two special dividends thrown in:
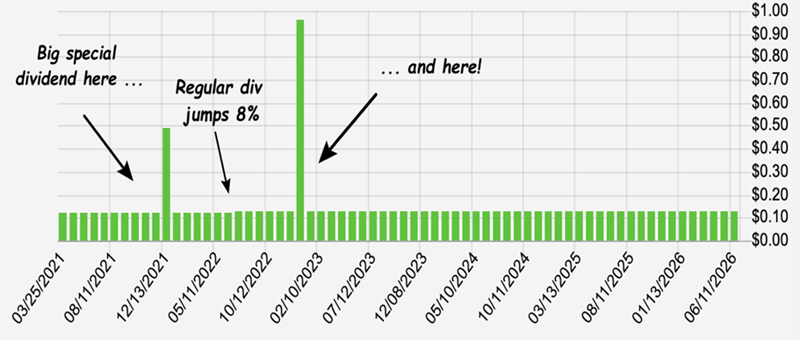
This ignored income play trades at a discount of nearly 6%. That doesn’t sound like much, but it has only seen markdowns like this a handful of times during the fund’s existence.
And the last time that happened—in late 2023—that discount vanished in less than two weeks.
I’m urging my readers to take a close look at this one now, while we can still do so for 94 cents on the dollar. I don’t want you to miss out. Click here and I’ll lay out my research for you and give you a Special Report revealing this 12%-payer’s name and ticker.