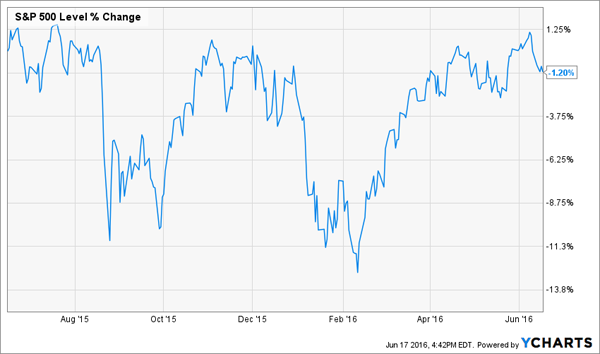
Are you relying on this casino for your retirement income?
The S&P 500, after two major heart palpitations, sits 1.2% lower than it did this time last year. That’s a tough roller coaster to ride if you actually need the money you invest in stocks! Plus, the index only pays a 2.1% yield due to its elevated price levels. That’s not very much income.
Then again you probably know this already. And perhaps you’ve attempted to stabilize your retirement ship by investing only in America’s best blue chip stocks. That’s definitely preferable to the broader market, but do me a favor and check out the following two charts. Which would you rather rely on for dividend income?
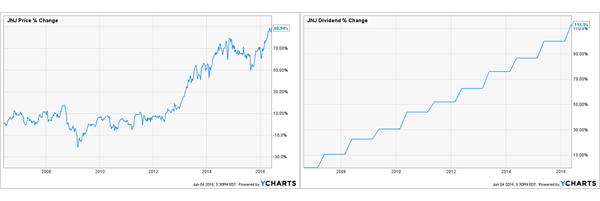
Of course the chart on the right. It’s increased steadily for the past 10 years with no blips. It represents the dividends paid by Johnson & Johnson (JNJ), while its cardiac companion is the price of JNJ’s stock itself over the past decade.
Problem is, you’re probably buying the manic chart on the left today. Which means you’re exposing yourself to short-term price risk to collect a 2.8% dividend.
There are two issues with this approach. First, you’re putting your retirement portfolio in the way of a potential stock market crash (which will take down JNJ too) in order to collect the income it pays investors. Which brings me to the second – and much bigger – problem.
You’re risking a lot for a stingy 2.8%!
Even if you buy $1 million worth of JNJ, you’re only collecting $28,000 in income annually. That’s less than your neighborhood Starbucks barista earns.
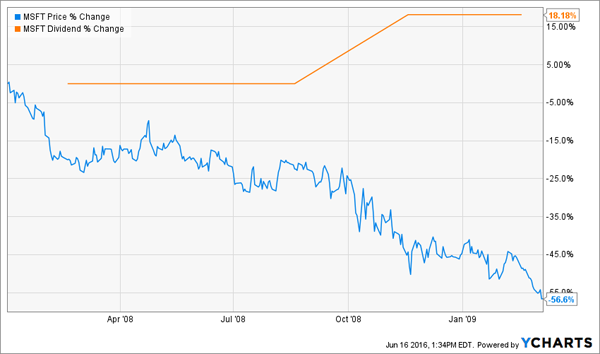
How about these two charts – which would you rather own?
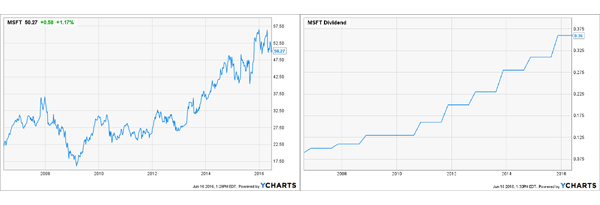
The chart on the left is the stock price of Microsoft (MSFT) for the past decade. Investors who bought and held the entire time did fine, of course – and also enjoyed the steady dividend growth on the right. In fact, they’re now earning a 6.5% yield on their initial investment – nice.
But what if you didn’t buy Microsoft a decade ago? Then you’re faced with the same dilemma on where to put your “new money” to work for income. After all, MSFT only pays a 2.9% yield today.
And it’s not a matter of aristocrat-picking prowess. Let’s take four more blue chip “dividend aristocrats” – Kimberly-Clark (KMB), McDonalds (MCD), Sysco (SYY) and Wal-Mart (WMT). Their best growth days are behind them, though you’d never know it looking at their valuations. Here are their sales and dividend growth over the past five years, along with their current price-to-earnings (P/E) ratios and paltry yields:
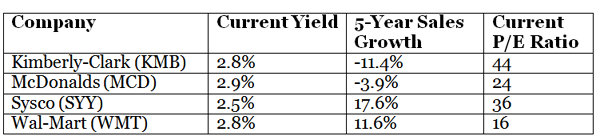
Sadly this 4-stock aristocrat portfolio only pays an average 2.75% yield today – even less than JNJ and MSFT – which means a $1 million portfolio will only earn you $27,500 in dividend income annually invested in these shares.
The solution that financial advisors pitch is a “4% withdrawal rate”. These guys (who have not successfully retired yet themselves, by the way) say that you should supplement your dividend income by withdrawing 4% or so annually from your capital basis. Sounds good on paper but it’s often bad news in reality due to some disastrous market math.
The 4% Withdrawal Flaw is Reverse Dollar Cost Averaging
Here’s the fatal flaw with the 4% annual withdrawal strategy for retirement. Every few years, you’re faced with a chart that looks like this:
You’re forced to withdraw money at exactly the wrong time. The dividend is fine, but you need to sell shares for additional income. Remember the benefits of dollar cost averaging that built your retirement portfolio? This is the same phenomenon, but in reverse!
With a 4% withdrawal portfolio, you sell more shares of stock when prices are low, and less when prices are high. Not good – it’s actually a recipe for running out of money.
The “No Withdrawal” Portfolio
The proper solution is one you’ve probably thought of – a no withdrawal portfolio that relies entirely on dividend income and leaves your principal 100% intact. But again, the dilemma is that a million bucks in most dividend aristocrats won’t get you enough dividend income to live off of – unless you have significant capital.
Alternative retirement products such as single premium immediate annuities (SPIAs) can help exchange capital for income streams – but in most cases you are giving up your principal.
But, you may be asking, don’t stocks only pay gaudy yields like these at the depths of bear markets?
That’s partially true – blue chips tend to only pay yields of 5% or better near secular stock market bottoms. However there are three other stock market vehicles available today that pay reliable yields of 7% and even 8% or higher – which translates to annual income streams of $70,000 or $80,000 or more on a million dollar portfolio.
How? With investment vehicles that have market caps around $1 or $2 or $3 billion. They’re plenty liquid enough for you and I, but not for the big institutional investors that hold two-thirds of all shares in public stocks. Combined they make up only a fraction of the stock market’s total capitalization – so they don’t get much coverage from the financial media.
And that makes these ignored corners of the financial markets ideal places for us to search for high yields – which is why they are favorites of the high priest of fixed income, the “Bond God” Jeffrey Gundlach himself. Click here and I’ll explain why he likes them so much – and also share the tickers of these secure funds that pay 8%, 8.4% and 11% yields too.